Bitcoin miner inflows to Binance soar as BTC struggles to hold uptrend: Is $70K next?

Bitcoin (BTC) miner inflows to Binance crossed 20,000 BTC for only the second time this year, placing fresh pressure on Bitcoin’s daily uptrend near the $75,000 support zone. Will BTC defend its higher-timeframe bullish structure, or is the market on the verge of a broader bearish trend shift?
BTC miner supply meets weaker demand
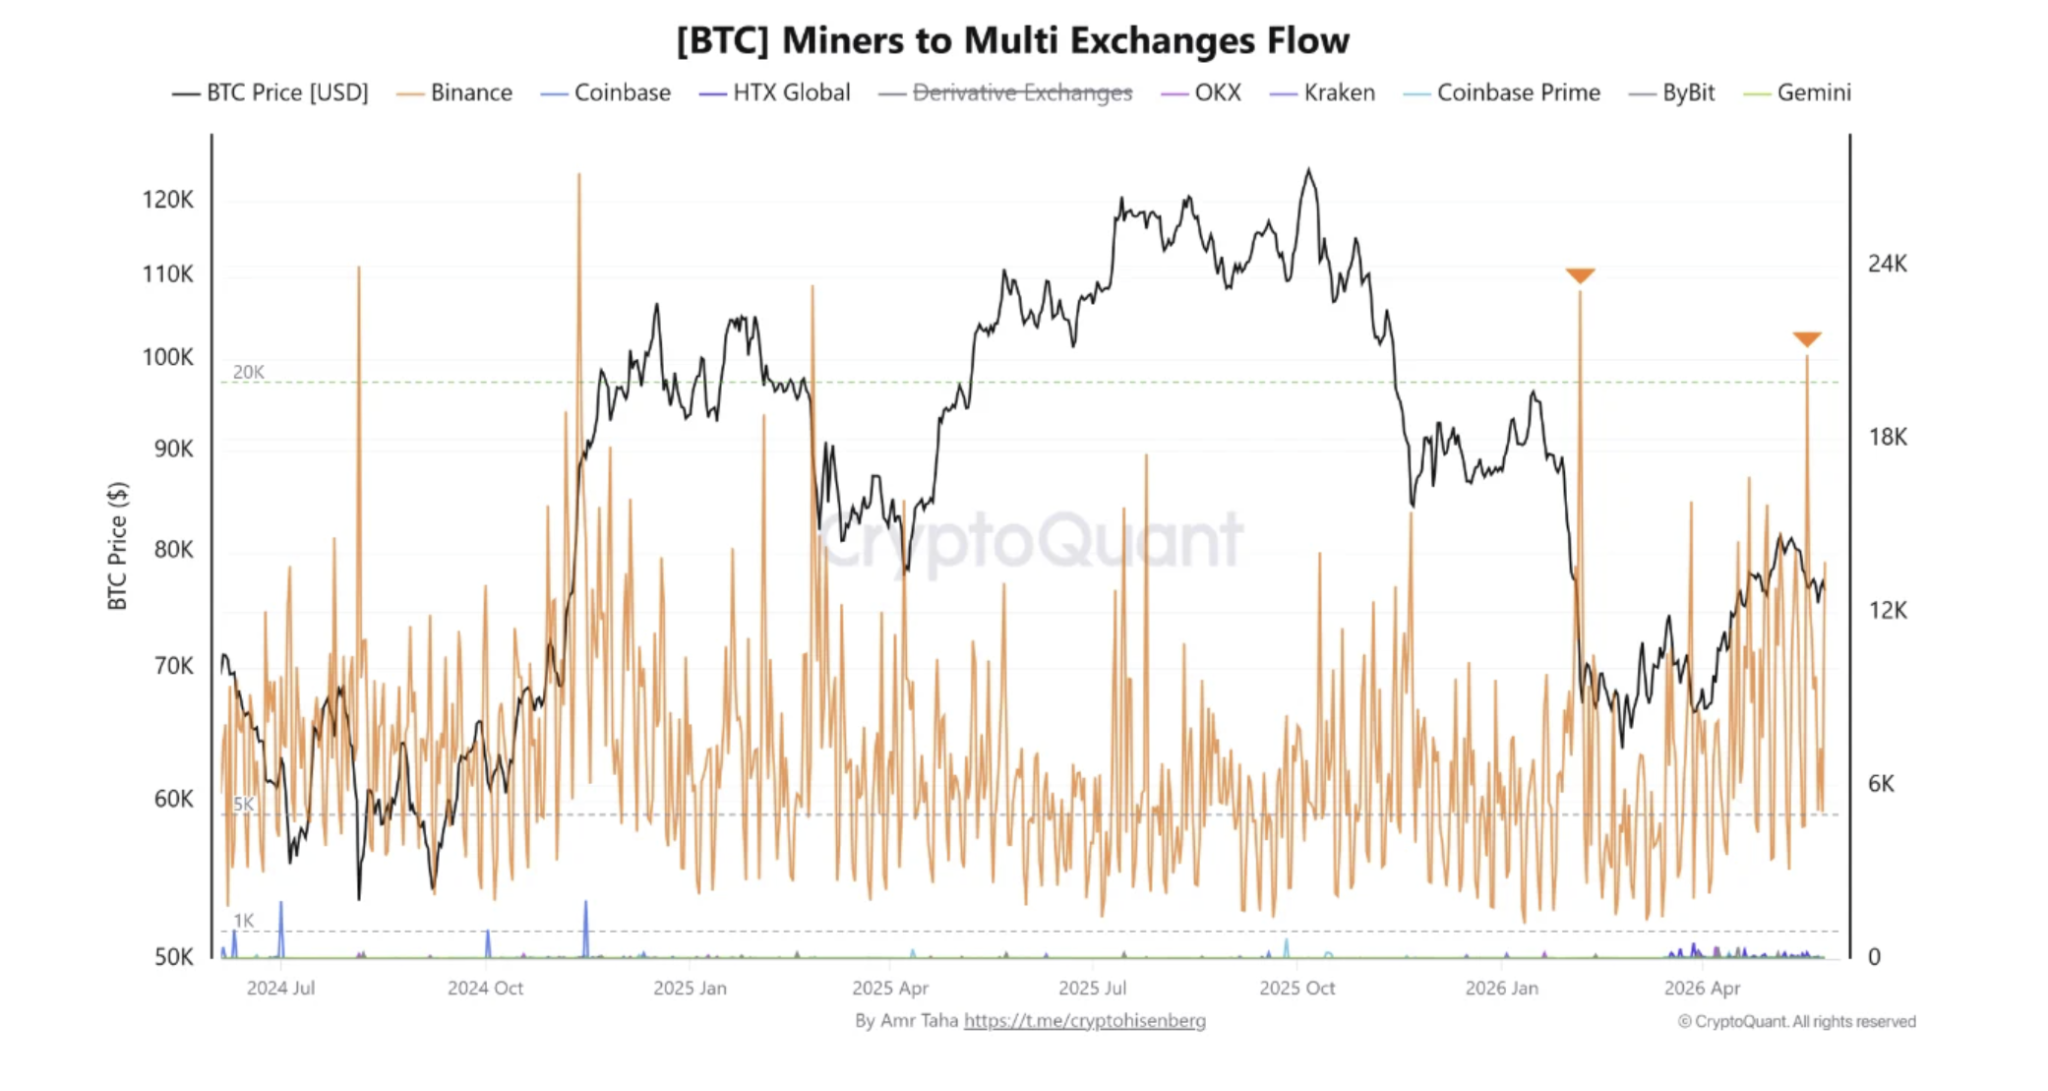
Crypto analyst Amr Taha said miners transferred roughly 21,000 BTC to Binance on May 18, close to the 23,150 BTC sent on Feb. 5. Large miner deposits are often tied to potential selling activity as miners move BTC to exchanges to cover operating costs.
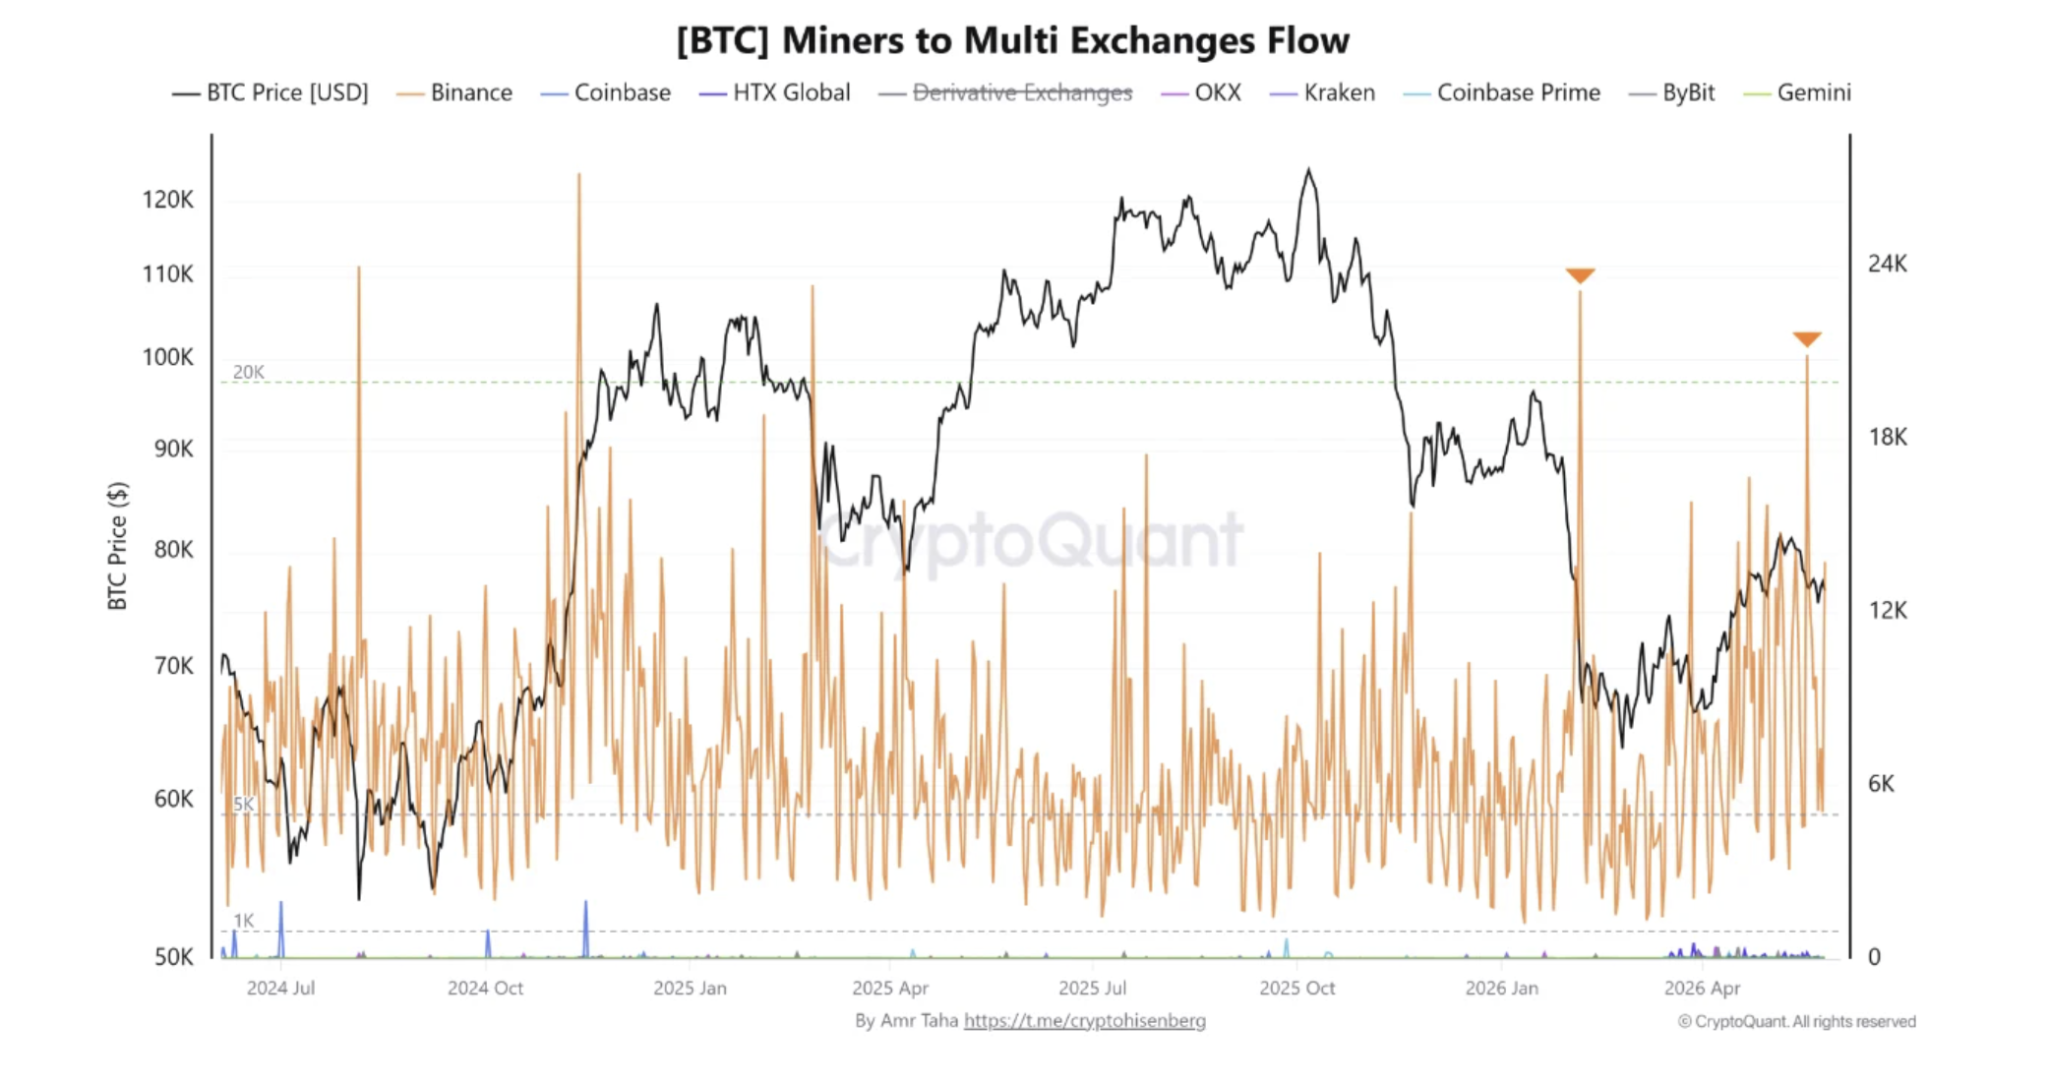
BTC miners to exchange flow data. Source: CryptoQuant
However, Taha explained that the market reaction has stayed relatively controlled so far. Bitcoin avoided a sharp breakdown after the transfer, while Binance’s BTC reserve climbed to nearly 634,000 BTC by May 26 from roughly 618,600 BTC on May 6. The exchange added around 15,400 BTC in reserves over the period without triggering aggressive downside continuation.
Glassnode’s onchain data painted a similar picture of slowing momentum rather than panic selling. The realized profit/loss ratio currently sits near 1.56, well below the 2-5 range commonly seen during stronger bull-market phases. The metric measures realized profits relative to losses across the network and points to moderate buying conviction during the recent rebound.
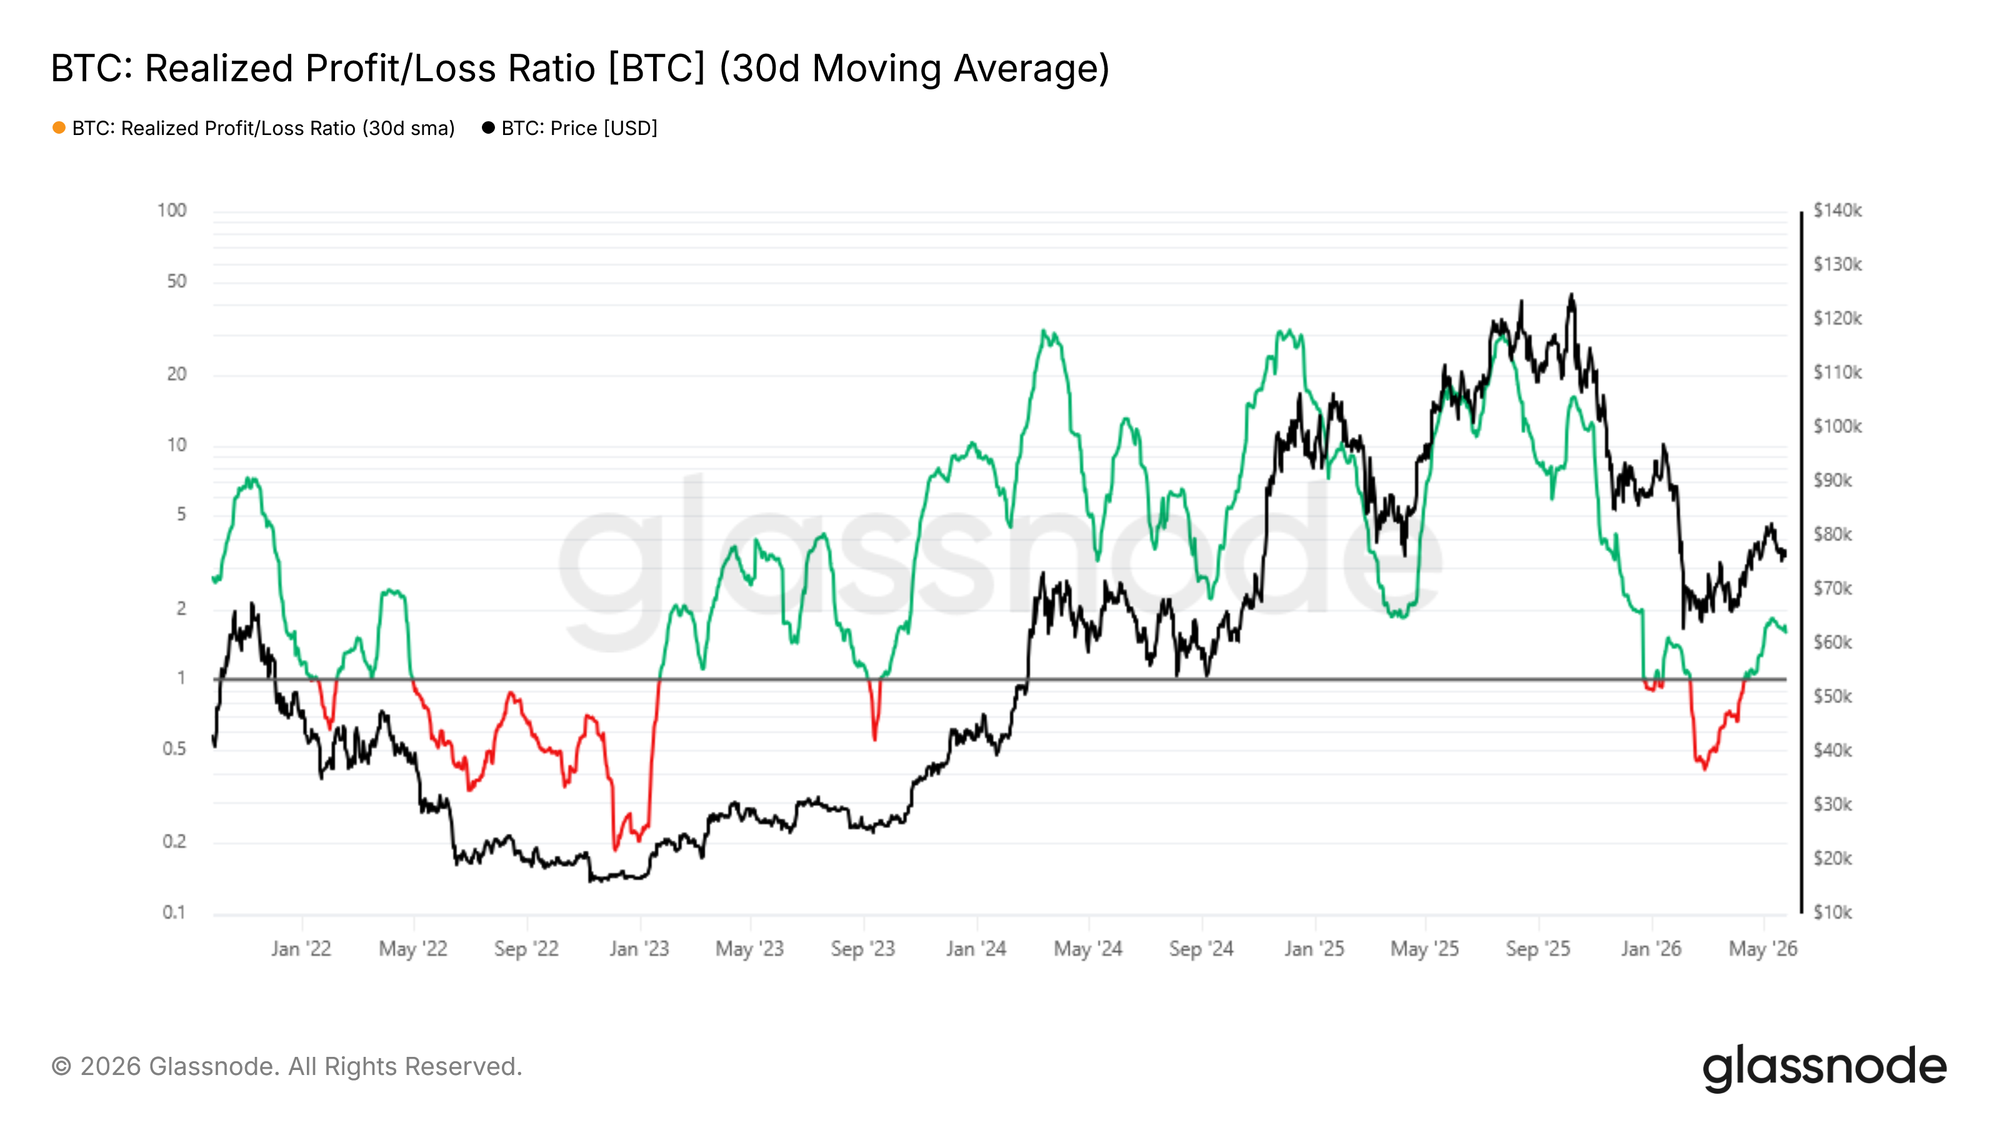
BTC realized profit/loss ratio 30-day moving average. Source: Glassnode
Additionally, Glassnode added that spot demand also weakened over the past two weeks. The spot volume delta slipped back into net sell-side territory after Bitcoin rejected near the low-$80,000 range. The analytics platform noted,
“If BTC is going to push meaningfully higher from here, spot demand likely needs to step back in. Without that, the market risks drifting back into the same choppy, seller-dominated conditions that capped upside earlier in the year.”
Related: Bitcoin price threatens $75K loss as US-Iran peace progress sparks new stocks records
BTC uptrend faces key test at $75,000
Bitcoin’s higher-time-frame trend still depends on holding above the $75,000 level. The level served as a consistent demand zone throughout May and closely aligns with the neckline support on the daily chart.
However, a developing head-and-shoulders pattern has begun to form after repeated failures near the $80,000-$81,000 range. The latest lower high near $78,000 now shapes the potential right shoulder of the setup.
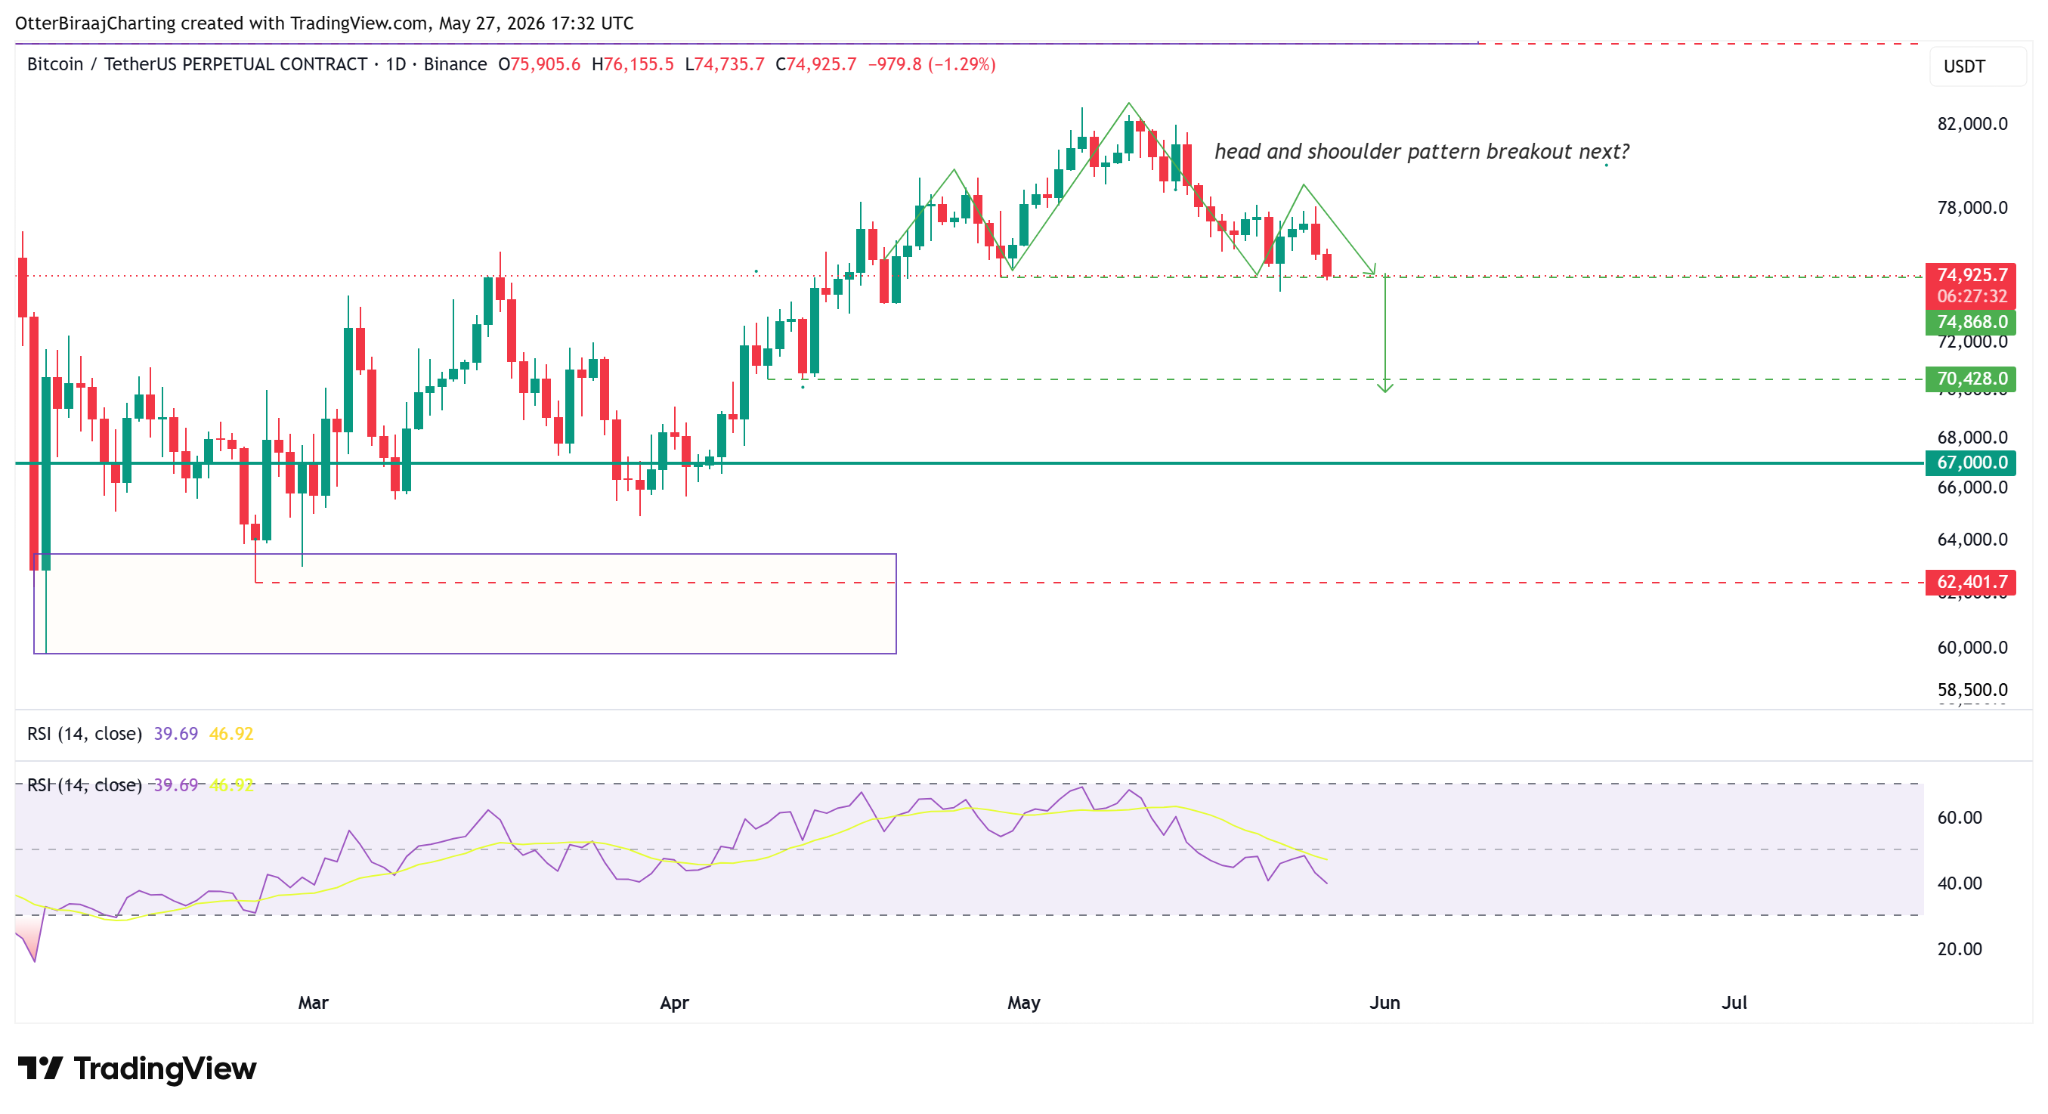
BTC/USDT, one-day chart. Source: Cointelegraph/TradingView
A momentum indicator also leans bearish. The daily relative strength index (RSI) has remained below the neutral 50 level for the past few days, indicating limited strength during recent rebounds. A decisive move below $75,000 could expose the next major support near $70,400.
Bitcoin researcher Axel Adler Jr. highlighted the $74,500 area as a critical support level, which currently aligns with the lower boundary of Bitcoin’s 21-day Donchian channel. The Donchian channel tracks the highest and lowest price range over a selected period and is often used to identify trend support and breakout zones.
If the price is holding near the lower band, it usually signals that buyers are defending the recent trading range, while a breakdown below it can signal rising downside pressure.
Adler noted that Bitcoin’s composite trend signal recently shifted back into a “high bear” zone following a sharp three-week reversal from the May highs near $82,500. BTC now trades only slightly above the $74,500 support band, placing the $74,500-$75,000 region at the center of current market attention.
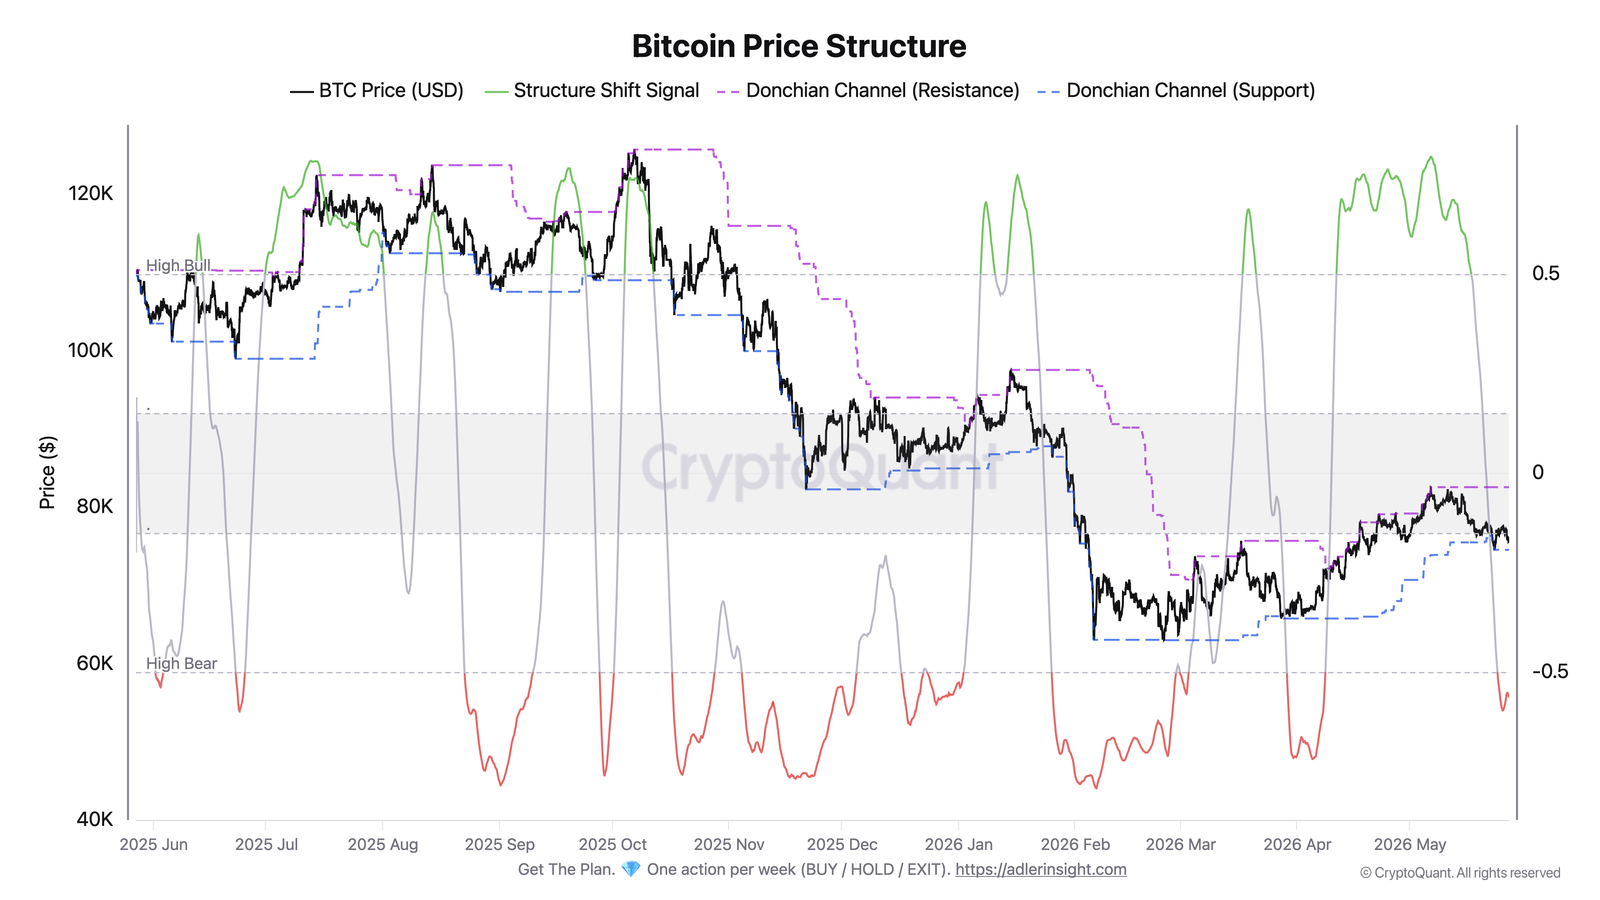
Bitcoin price structure. Source: CryptoQuant
Related: Sold in May and went away? Bitcoin risks another 10% drop as month turns red