Crypto Volatility Indicator: ATR, Bollinger Bands, CVI & DVOL
Most beginners look at a crypto chart and see chaos. Volatility indicators exist to turn that chaos into something readable. In this guide, we walk through each major tool (ATR, Bollinger Bands, Keltner Channels, CVI, DVOL, and more) and show you precisely how they work, what they measure, and how to start using them even if you’re just getting started.
What Is a Crypto Volatility Indicator?
A crypto volatility indicator is a tool that measures how much price moves in the cryptocurrency market. It tracks the size of price swings, not their direction. It does not tell you whether the price will rise or fall. It tells you how much movement is happening or may be expected. That makes volatility indicators useful for assessing risk, especially when markets are moving quickly.
The 3 Main Ways Crypto Volatility Is Measured
In crypto, volatility is usually measured in three ways. You can look at what already happened, what has been observed in the market, or what options markets expect to happen next. Each approach gives you a different view of market movement.
Historical Volatility: What Already Happened
Historical volatility measures how much price has varied over a past period. It is a backward-looking metric based on historical price data rather than future expectations. It is useful for comparing past market conditions and adding context to current price behavior. Historical volatility can support risk planning, especially over longer time frames. But it has limits. It only tells you what happened in the past, not what will happen next.
Realized Volatility: Observed Market Movement
Realized volatility refers to volatility calculated from actual price movement. Like historical volatility, it is based on observed data rather than forecasts. Traders use realized volatility to understand how much the market has actually moved over a defined period. That can help identify high- and low-volatility environments and refine trading decisions.
Realized volatility can also add context to possible market shifts. For example, a sudden increase in movement over a short time frame may suggest changing conditions and higher near-term risk.
Implied Volatility: What Options Markets Expect
Implied volatility is a forward-looking metric derived from options prices, not historical price charts. It reflects market expectations for future price movement. Unlike historical or realized volatility, implied volatility is based on what options traders are pricing in. That makes it useful for understanding expectations around future turbulence, even though it does not predict direction. In crypto options markets, tools such as DVOL help track implied volatility on BTC and ETH. These benchmarks can give traders a live view of how the market is pricing expected movement.

How to Get Free Crypto
Simple tricks to build a profitable portfolio at zero cost

Chart Indicators vs. Crypto Volatility Indices
Chart-based volatility indicators and volatility indices serve different purposes.
Indicators such as ATR, Bollinger Bands, and Keltner Channels sit directly on price charts. They measure movement using actual market data and help traders understand how active price action is.
Indices such as DVOL, CVI, and the CF Bitcoin Volatility Index work differently. They translate options market data into implied volatility benchmarks and help traders read broader market expectations.
Used together, these tools can provide a more complete view of volatility. Chart indicators show what price is doing now, while indices can show what the market expects next.
Crypto Volatility Indicators
Below are seven widely used volatility indicators and indices that appear regularly in market analysis. They include chart-based tools such as ATR, Bollinger Bands, Keltner Channels, and Donchian Channels, as well as options-based benchmarks such as CVI, CF Bitcoin Volatility Index, and DVOL.
Understanding how to read these tools can help you assess market conditions and make more informed trading decisions.
Average True Range, or ATR: The Classic Volatility Gauge
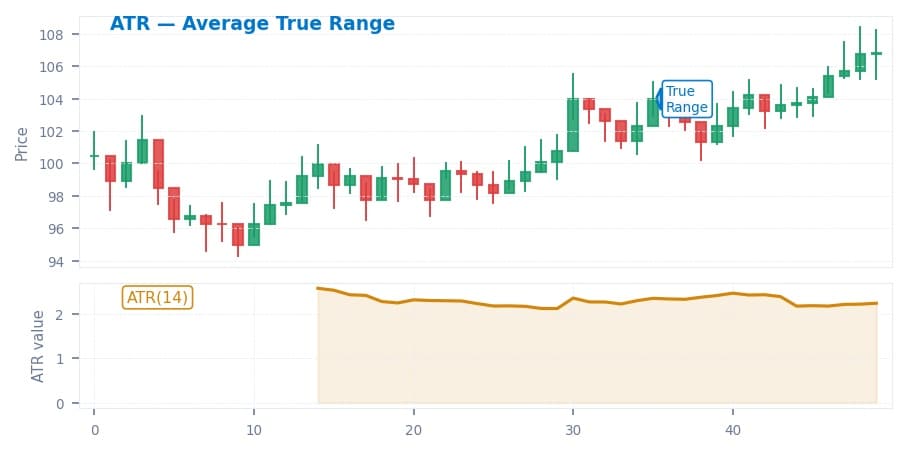
Average True Range, or ATR, is a widely used volatility indicator that measures the average size of price movement, not direction. It is typically calculated over a set lookback period, often 14.
- ATR quantifies volatility by averaging true range values over a defined number of periods.
- True range is the largest of three values: the current high minus the current low, the absolute value of the current high minus the previous close, and the absolute value of the current low minus the previous close.
- A 14-period ATR uses 14 candles, a common setting that balances short-term and medium-term noise.
ATR is often used for stop-loss placement, position sizing, and trade planning. It helps traders understand how much an asset typically moves over a given period.
Its limitation is simple: ATR measures movement, but it does not predict direction.
Bollinger Bands: Reading Expansion and Contraction
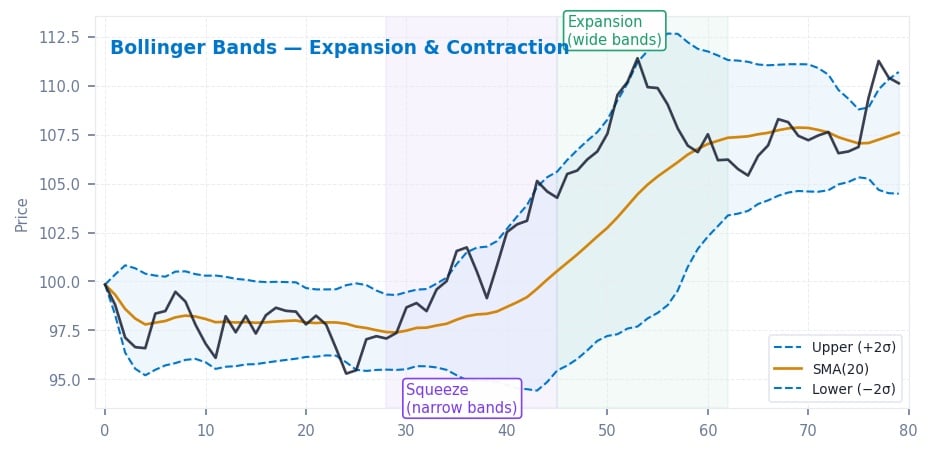
Bollinger Bands are a classic volatility indicator built around a moving average with upper and lower bands placed above and below it.
The default setup usually uses a 20-period simple moving average in the middle and bands set two standard deviations away from that average. When the bands widen, volatility is increasing. When they narrow, volatility is decreasing.
- The upper band sits above the moving average and reflects higher volatility when price expands.
- The middle band is the simple moving average.
- The lower band sits below the moving average and helps show contraction when volatility falls.
Traders often use Bollinger Bands to spot compression and expansion. They may also watch for overextended price action, but those signals are usually more useful when confirmed with other tools such as volume, ATR, or RSI.
Keltner Channels: ATR-Based Volatility Bands
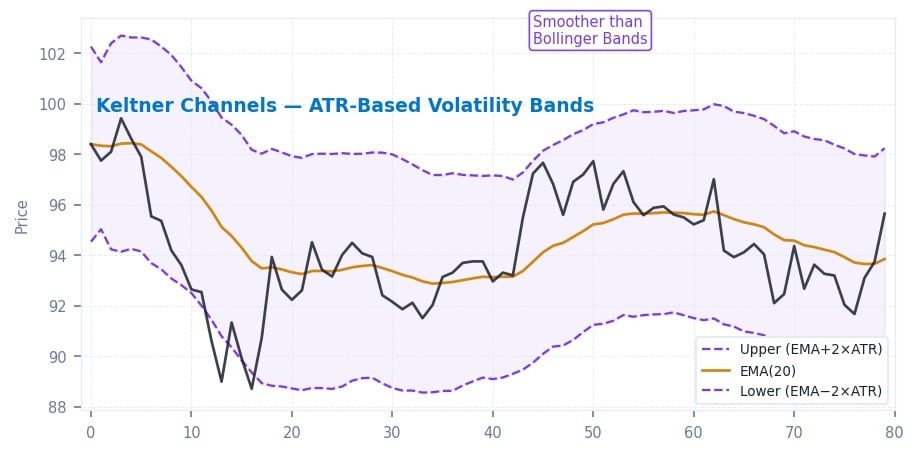
Keltner Channels are another volatility indicator used in technical analysis. Unlike Bollinger Bands, which rely on standard deviation, Keltner Channels typically use an exponential moving average as the center line and ATR to set the band width. The multiplier is set to 2 to filter out noise from sharp short-term spikes.
This structure creates a smoother envelope around price. That can make the indicator useful for identifying market structure, trend conditions, and areas where price may be stretching beyond its normal range.
Donchian Channels: High-Low Breakout Context
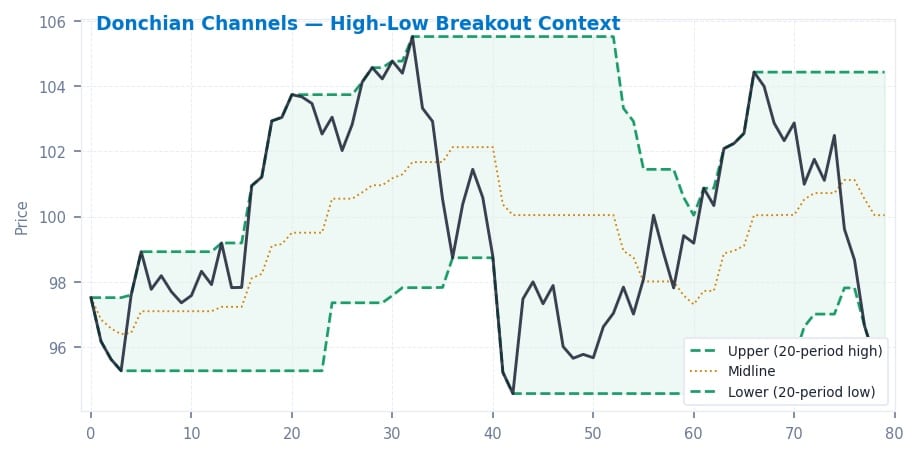
Donchian Channels are based on recent highs and lows rather than standard deviation or ATR. They help traders visualize breakout levels by marking the upper and lower boundaries of a chosen lookback period.
If price breaks above the upper boundary or below the lower boundary, traders may treat that as breakout context. If price remains inside the channel, it can suggest consolidation.
Donchian Channels do not measure volatility in the same way ATR does, but they are still useful for understanding price expansion, contraction, and breakout behavior.
Standard Deviation: The Math Behind Many Volatility Indicators
Standard deviation is a core statistical concept that measures how far values move from their average. In market analysis, it helps show how tightly or widely prices cluster around the mean.
That is why standard deviation is central to tools such as Bollinger Bands. As volatility increases, the bands move farther from the average. As volatility falls, they contract.
Even when you do not use it directly, standard deviation is part of the logic behind many volatility tools.
Crypto Volatility Index, or CVI: A Crypto Fear-Gauge Style Index
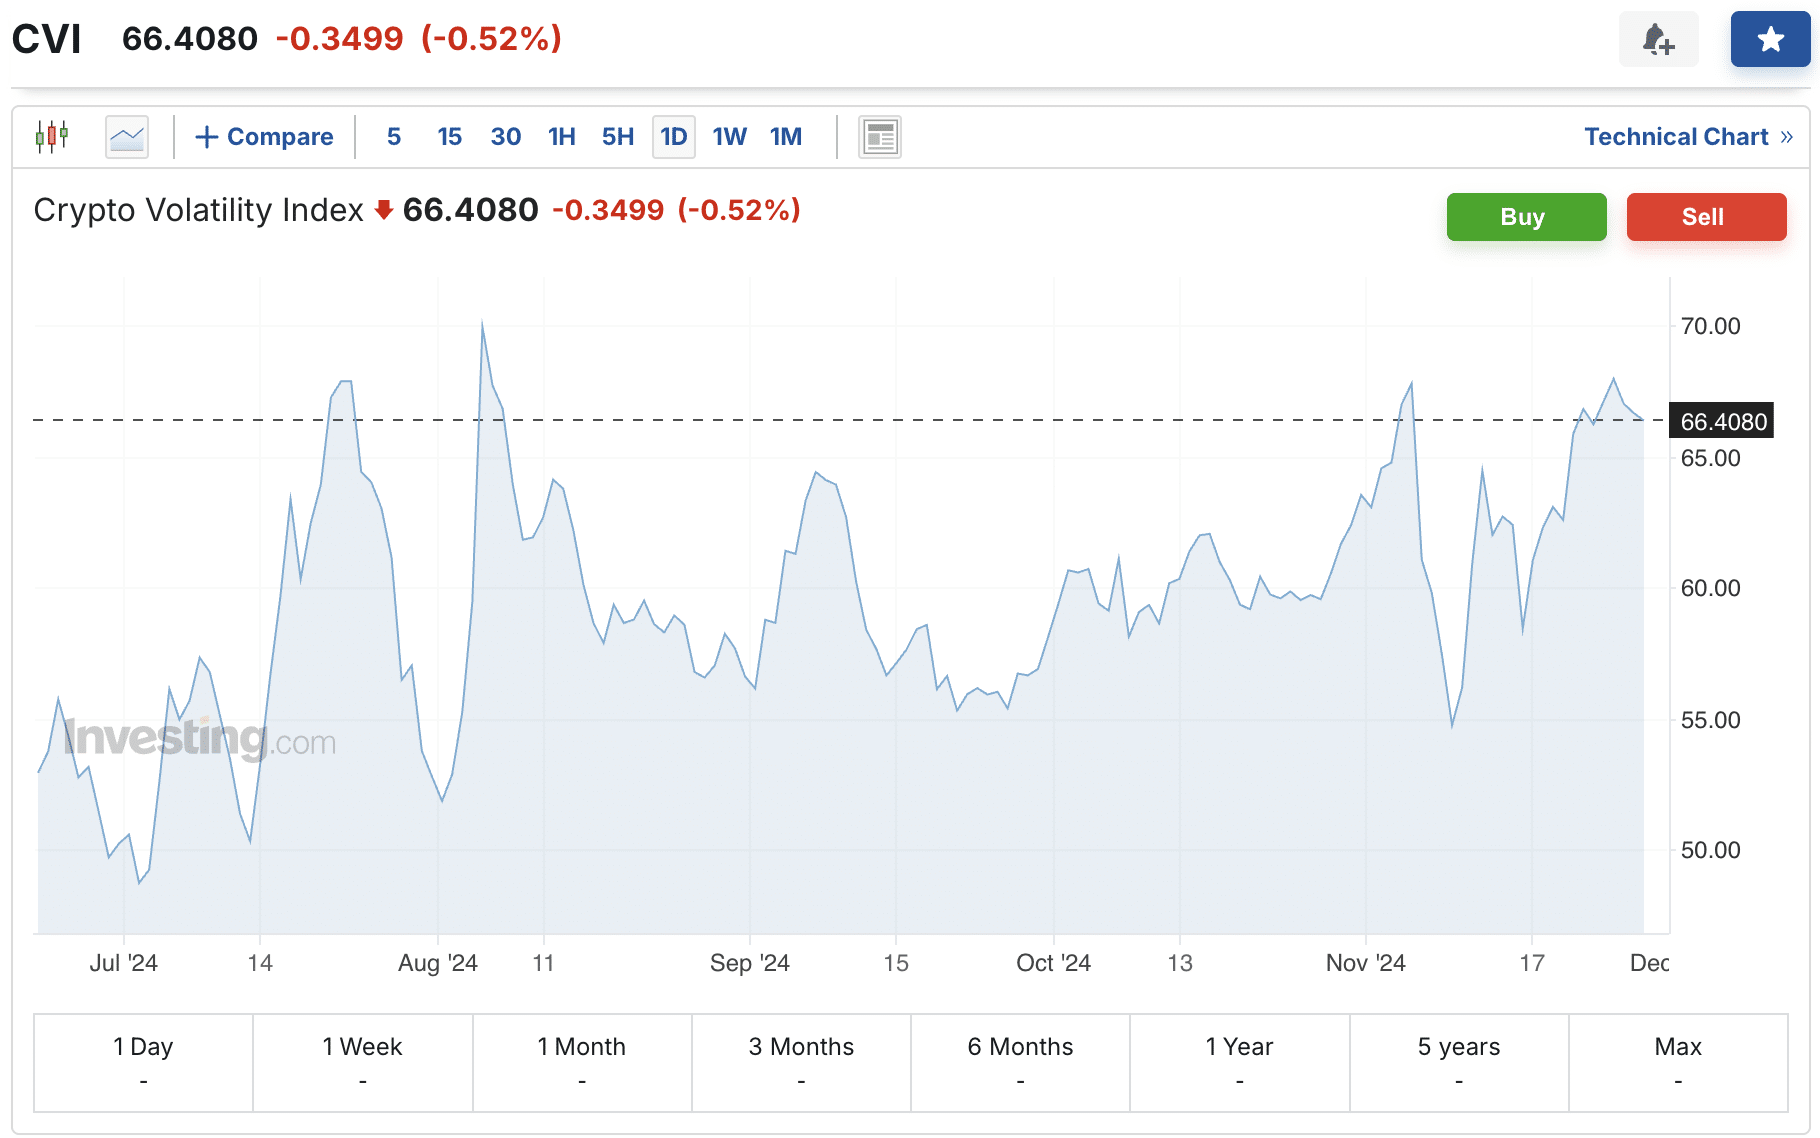
The Crypto Volatility Index, or CVI, is a decentralized, forward-looking benchmark for implied volatility in Bitcoin and Ethereum markets. Unlike traditional volatility tools, CVI is built on DeFi infrastructure, meaning it operates without a central authority and is accessible directly on-chain.
CVI derives its readings using a methodology rooted in the Black-Scholes options pricing model. Rather than pulling from historical price charts, it extracts implied volatility from crypto options markets and converts that output into a 0–200 scale. A low reading suggests the market expects calm conditions. A high reading signals that traders are pricing in significant turbulence ahead.
That forward-looking structure makes CVI useful for tracking sentiment, expected volatility, and market stress—not just what has happened, but what options markets think is coming next.
The CVI ecosystem also introduces two instruments that traders can interact with directly. The GOVI token is the governance asset of the CVI platform, giving holders a say in protocol decisions and parameter updates. Volatility tokens, on the other hand, are DeFi derivative-like instruments that provide direct exposure to crypto volatility itself—allowing traders to go long on volatility without needing to trade options directly.
To keep its data feeds reliable and manipulation-resistant, CVI integrates with Chainlink’s decentralized oracle infrastructure. Chainlink supplies the on-chain price and options data that CVI’s model depends on, connecting real-world market inputs to the protocol’s smart contracts in a trustless way.
DVOL: Deribit’s Implied Volatility Index
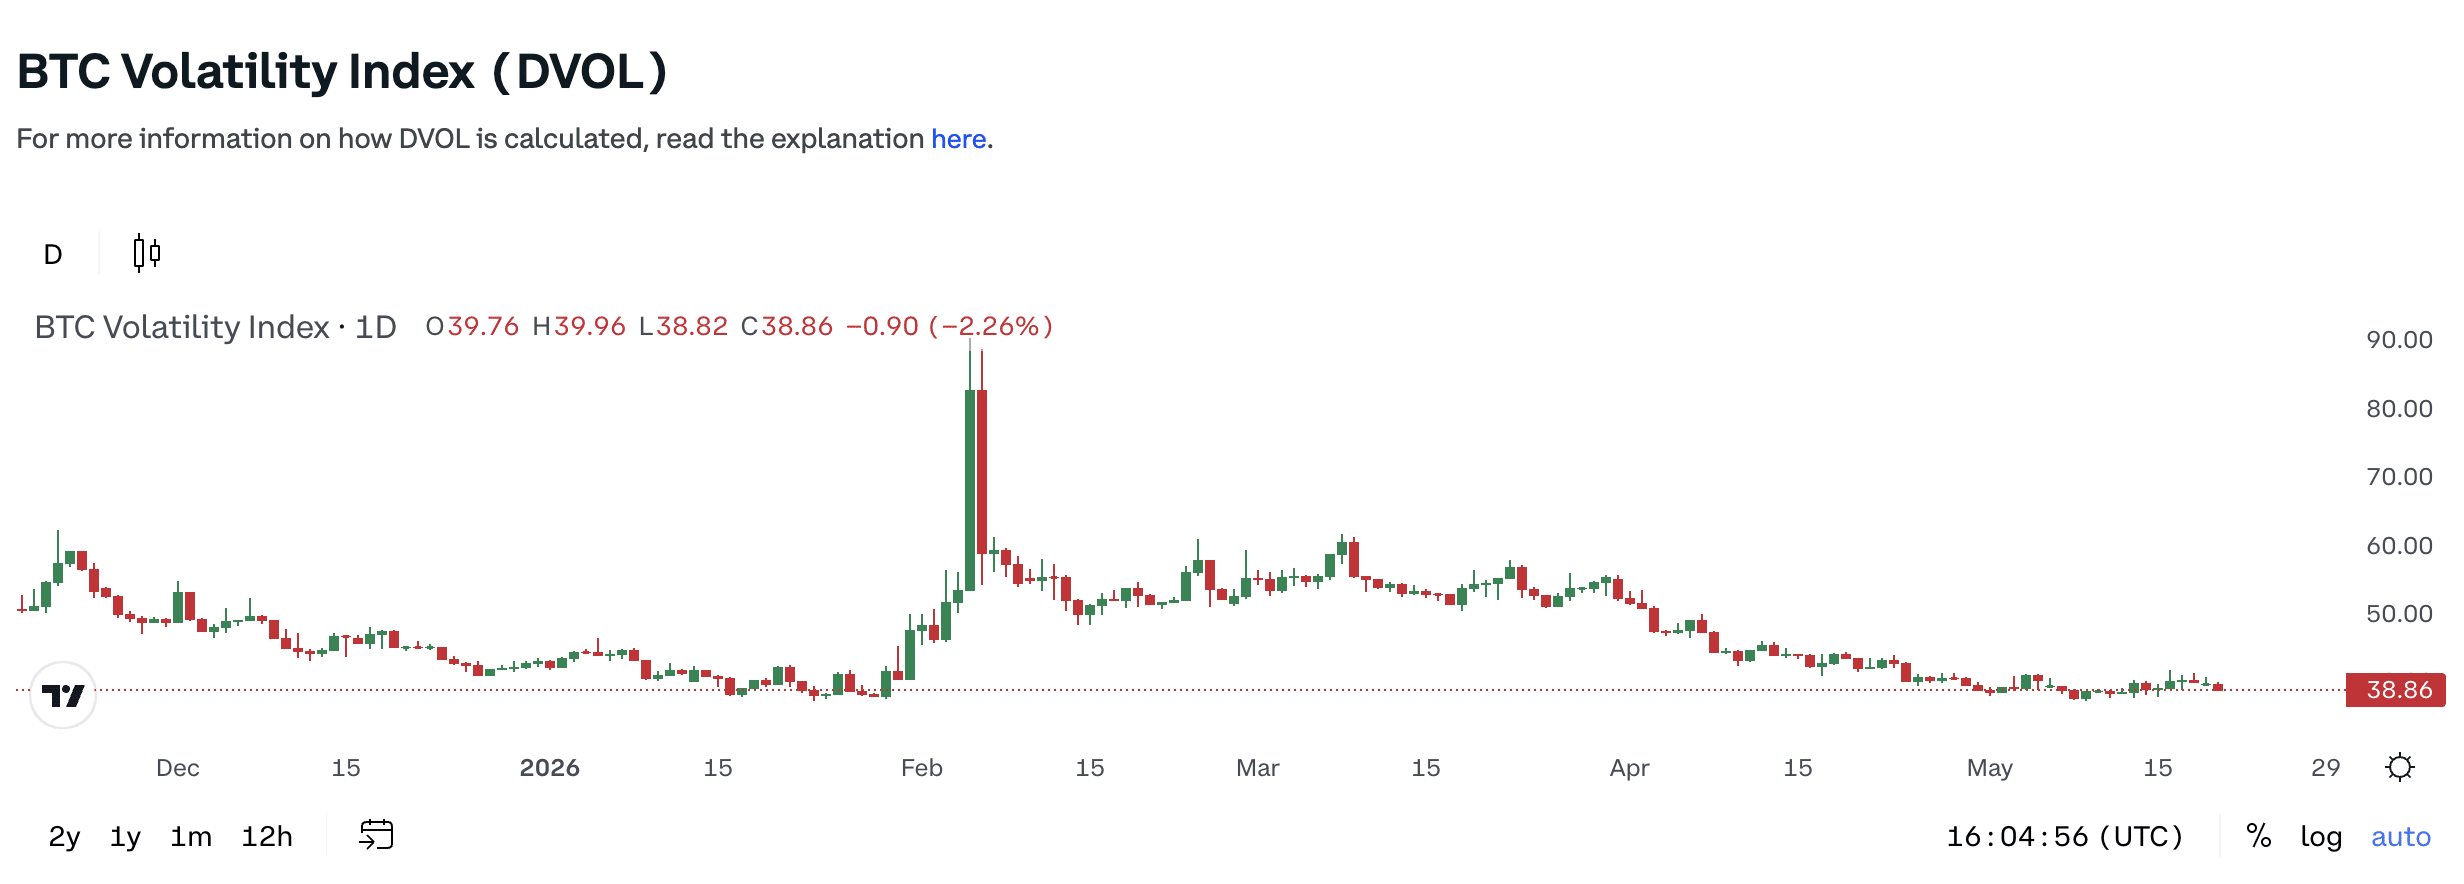
DVOL is an implied volatility index based on BTC and ETH options data from Deribit. It tracks 30-day implied volatility using options pricing and offers a real-time view of expected movement—functioning, in concept, similarly to how the VIX works for traditional equity markets. Where the VIX measures expected volatility in the S&P 500, DVOL does the same job for Bitcoin and Ethereum, giving crypto traders a comparable benchmark that speaks the same language as institutional risk frameworks.
What separates DVOL methodologically is its use of the implied volatility smile. Rather than deriving a single volatility figure from at-the-money options alone, DVOL incorporates data across the full range of strike prices and expiration dates available on Deribit. Because implied volatility varies across strikes, forming a curve or “smile” shape when plotted, this approach produces a more complete and market-representative reading than simpler single-strike methods.
When DVOL rises, it generally suggests that options traders are pricing in greater future volatility. When it falls, expected movement is easing.
Since launching on Deribit in 2021, DVOL has become a widely cited benchmark in crypto options markets. Its readings are published and visualized through Glassnode, the on-chain analytics platform, which makes the index accessible to a broader audience beyond Deribit’s own interface. That distribution has helped establish DVOL as a go-to reference for both professional and retail traders who want a fast, methodology-grounded read on short-term implied volatility.
CME CF Bitcoin Volatility Indices: Institutional Bitcoin Volatility Benchmarks
The CF Bitcoin Volatility Index family is a set of benchmark-grade volatility readings created by CF Benchmarks. Unlike chart indicators such as ATR or Bollinger Bands, these are reference benchmarks used in derivatives and institutional market analysis.
These indices track annualized 30-day implied volatility for Bitcoin using data from options markets. They are designed to help market participants assess expected volatility in a more standardized way. The family includes BVX and BVXS. Together, they provide institutional traders with benchmark tools for hedging, stress testing, and broader risk management.
How to Choose the Right Crypto Volatility Indicator
Different volatility indicators serve different purposes. Some help with stop-loss planning. Others help with breakout context, compression, or options market expectations.
Your choice depends on your goal, experience level, and market focus.
For Beginners: ATR and Bollinger Bands
For beginners, ATR and Bollinger Bands are often the most accessible starting points.
ATR helps you understand average movement and think more clearly about position sizing and stop placement. Bollinger Bands help you visualize volatility expansion and contraction directly on the chart.
Together, they offer a practical introduction to volatility without requiring options market knowledge.
For Stop-Loss Planning: ATR
ATR is commonly used for stop-loss planning because it shows how much an asset typically moves over a given period.
That can help you set stops with more context instead of placing them too tightly around normal price noise. It can also help you think more clearly about position size and risk-reward balance.
For Volatility Compression: Bollinger Bands and Keltner Channels
If you want to identify volatility compression, Bollinger Bands and Keltner Channels are often used together.
Periods of tightening price action can suggest that a larger move may be developing. But compression alone does not guarantee a breakout, so traders often combine these indicators with support and resistance, volume, or trend confirmation.
For Breakout Context: Donchian Channels
Donchian Channels are useful when your main goal is identifying breakout context.
They show recent price boundaries clearly, which can help you see when price is approaching or moving beyond established highs and lows. That makes them useful for trend-following setups and breakout analysis.
For Options Market Expectations: CVI, DVOL, and CF Bitcoin Volatility Indices
If you want to understand what the market expects next, options-based volatility indices can be more useful than chart overlays.
CVI offers a broader sentiment view. DVOL provides a real-time reading based on Deribit options data. CF Bitcoin Volatility benchmarks are more relevant to institutional use cases and benchmark-style analysis.
Common Mistakes When Using Crypto Volatility Indicators
Even experienced traders can misuse volatility indicators when they read them without context. Common mistakes include:
- Treating a volatility spike as a directional signal
- Using ATR as a predictive tool rather than a risk tool
- Assuming lower volatility means there is no opportunity
- Relying on a single timeframe
- Expecting a volatility reading to reveal a price target
- Using the wrong indicator for the wrong purpose
Mistake #1: Thinking Volatility Means Direction
Volatility measures the size of price movement, not whether price will move up or down.
This is one of the most common mistakes traders make. A market can become more volatile without giving any reliable directional signal.
Mistake #2: Treating a Squeeze as a Guaranteed Breakout
A squeeze can suggest that volatility is compressed and that a larger move may be coming. It does not guarantee a breakout. If you trade a squeeze without confirmation, you can end up reacting to a false move or a period of continued consolidation.
Mistake #3: Using One Indicator Without Confirmation
No single indicator should carry your entire decision.
Volatility signals are usually stronger when they are confirmed by volume, support and resistance, broader market structure, or other technical tools.
Mistake #4: Ignoring Time Frame Differences
Volatility can look very different across timeframes. A setup on the hourly chart may not matter much if the daily trend shows a completely different picture. Traders should always read volatility in the context of the timeframe they are using.
Mistake #5: Applying Default Settings Blindly
Default settings such as a 14-period ATR or 20-period Bollinger Bands are common for a reason, but they are not perfect for every asset or strategy. Different tokens, market conditions, and trading styles may call for different settings.
Mistake #6: Confusing High Volatility with a Good Trade
High volatility can create opportunity, but it can also increase risk. A fast-moving market is not automatically a good setup. If direction is unclear, liquidity is weak, or confirmation is missing, high volatility can make a trade harder to manage.
A Simple Step-by-Step Workflow for Reading Crypto Volatility
If you want to use volatility more effectively, a simple process can help.
- Choose the asset and timeframe first
- Define your goal before reading the indicator
- Check volume and broader market context
- Pick the right volatility tool for the job
- Look for confirmation from trend or structure
- Decide whether the risk is acceptable before acting
Step 1: Pick the Asset and Timeframe
Start by choosing the asset and timeframe you want to trade. Volatility in Bitcoin on a 15-minute chart can look very different from volatility in a lower-liquidity token on the same timeframe. Context matters.
Step 2: Check ATR for Average Movement
Use ATR to understand what normal movement looks like in current conditions.
That can help you set more realistic stops and position sizes while avoiding trades that do not fit your risk tolerance.
Step 3: Check Bollinger Bands for Expansion or Contraction
Bollinger Bands can help you see whether volatility is expanding or contracting.
Wide bands suggest stronger movement. Tight bands suggest compression and the potential for a larger move later.
Step 4: Look for Squeeze or Breakout Context
Use Bollinger Bands, Keltner Channels, or Donchian Channels to assess whether the market is compressing or breaking out. Just remember that these setups are more useful when you confirm them with broader market context.
Step 5: Confirm With Trend, Volume, or Support and Resistance
Before acting, check whether the move is supported by trend, volume, or key levels.
If those signals line up, the setup may be stronger. If they conflict, caution may be warranted.
Step 6: Decide Whether the Risk Is Acceptable Before Acting
Before entering a trade, make sure the risk fits your plan. Even a clean volatility setup is not worth taking if the position size, stop placement, or expected downside does not match your risk tolerance.
Final Thoughts
Crypto volatility measures how much price moves, not where it will go next.
That is why volatility indicators are best used as risk tools rather than prediction tools. They help you understand movement, compare conditions, and plan trades more realistically.
If you use them with context, they can improve your decision-making. If you use them in isolation, they can be misleading.
FAQ
What is the best volatility indicator for crypto?
There is no single best volatility indicator for every situation. ATR is a practical choice for measuring average movement. Bollinger Bands are useful for spotting expansion and contraction. CVI, DVOL, and CF Bitcoin Volatility benchmarks can help when you want a forward-looking view.
Is ATR good for crypto trading?
ATR is widely used in crypto trading because it helps measure average movement and supports risk planning. It is especially useful for stop-loss placement and position sizing. But like any indicator, it works best when used with other forms of analysis.
Are Bollinger Bands reliable for bitcoin?
Bollinger Bands can be useful on Bitcoin charts when they are read in context.
They help show whether volatility is expanding or contracting and can highlight possible compression or overextension. They are most useful when combined with other indicators or market structure analysis.
What does high volatility mean in crypto?
High volatility means price is moving more quickly or over a wider range than usual.
That can create opportunity, but it also increases risk. High volatility does not imply direction on its own.
What is the difference between ATR and Bollinger bands?
ATR measures how much price moves on average over a given period.
Bollinger Bands show volatility visually around a moving average using standard deviation. In simple terms, ATR tells you how much price moved, while Bollinger Bands help you see whether movement is expanding or contracting.
What is the difference between CVI and DVOL?
CVI and DVOL both track implied volatility, but they are built differently. CVI is an index-based measure of expected volatility for Bitcoin and Ethereum markets. DVOL is Deribit’s real-time implied volatility index based on options activity on its exchange.
Can volatility indicators predict breakouts?
Volatility indicators do not directly predict breakouts. What they can do is show when conditions are changing, especially during compression or expansion. That can help traders identify breakout potential, but confirmation still matters.
Should beginners use implied volatility indices?
Beginners can learn from implied volatility indices, but they are usually not the easiest place to start. Most new traders will find ATR and Bollinger Bands easier to understand first. Once those basics are clear, indices such as CVI and DVOL can add useful forward-looking context.
What is the safest way to use volatility indicators?
The safest way to use volatility indicators is to treat them as part of a broader process. Do not rely on one number or one chart signal alone. Use volatility tools alongside trend, volume, support and resistance, and risk management.
Disclaimer: Please note that the contents of this article are not financial or investing advice. The information provided in this article is the author’s opinion only and should not be considered as offering trading or investing recommendations. We do not make any warranties about the completeness, reliability and accuracy of this information. The cryptocurrency market suffers from high volatility and occasional arbitrary movements. Any investor, trader, or regular crypto users should research multiple viewpoints and be familiar with all local regulations before committing to an investment.
The post Crypto Volatility Indicator: ATR, Bollinger Bands, CVI & DVOL appeared first on Cryptocurrency News & Trading Tips – Crypto Blog by Changelly.
Cryptocurrency News & Trading Tips – Crypto Blog by Changelly


