Introducing multi-market price comparison charts on Kraken Desktop

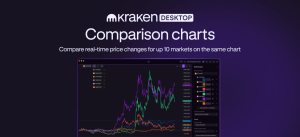
We are pleased to announce price comparison charts on Kraken Desktop. This new capability enables traders to compare up to 10 markets on a single chart, making it easier than ever to spot trends, visualize correlations and gain insights into market movements. Whether you’re tracking Kraken spot markets, perpetual contracts or fixed-maturity futures, this feature is built to support your trading strategy from every angle.
All your markets, one chart
With real-time comparison charts, you can now visualize market data for multiple time series on a single chart. Start by configuring your primary market, then add up to 10 other markets for side-by-side comparison. You can pan across different time frames, zoom in for detailed analysis or even apply drawing tools directly to your comparison chart for a deeper dive into market movements.
This feature is compatible with all Kraken spot and derivatives markets, making it a versatile addition to your trading toolkit. It’s especially powerful when comparing price trends across both perpetual and fixed-maturity futures, offering the insight needed to stay ahead of the game.
Three ways to visualize market data
Every trader has their own way of interpreting data, which is why Kraken Desktop offers three methods for comparing markets on a single chart:
- Gain/loss percentage: Visualize the percentage change for each market over a specified period. This view is perfect for assessing which markets are showing the largest gains or losses relative to one another.
- Relative index to 100: Normalize each market’s price data to a starting index of 100. This allows you to see how each market has moved relative to one another, making it ideal for tracking correlated movements across different assets or derivatives contracts.
- Single axis: Compare raw price data on a single axis, giving you a straightforward view of price trends. This is especially useful for analyzing fixed-maturity futures contracts of the same asset, allowing you to see how they diverge or converge over time.
And with full control over line styling and colors, you can customize each market’s representation to fit seamlessly into your existing trading dashboard.

How active traders can use real-time comparison charts
This powerful feature isn’t just about displaying data. It’s about leveraging information to enhance your trading strategy. Here are a few ways that active traders can use real-time comparison charts to identify opportunities and create a strategic edge:
- Spot correlation patterns: By comparing multiple markets on a single chart, traders can quickly identify correlations between assets. For instance, if Ethereum (ETH/USD) and Solana (SOL/USD) tend to move in tandem, a sudden divergence could indicate a potential trading opportunity, such as arbitrage or a shift in market sentiment.
- Analyze derivatives market structure: When analyzing Kraken’s fixed-maturity futures, the relative index to 100 view can be especially valuable. It allows traders to see how different derivatives contracts for the same asset behave over time. This makes it easier to spot discrepancies between current market prices and derivatives contracts, potentially uncovering mispricings that can be exploited.
- Track leading and lagging indicators: Use the gain/loss percentage view to see which assets are leading or lagging during a market move. This can help identify momentum shifts and traders can adjust their strategies accordingly – for example, pivoting into stronger-performing assets or taking advantage of a lagging market that is poised for a rebound.
- Seamless integration into your trading layout: Kraken Desktop’s comparison charts can be integrated into your existing trading layout alongside other modules like order books, depth charts and trade execution tools like order tickets or ladders. This allows you to create a custom dashboard tailored to your trading style, where you can analyze comparative data without losing sight of the broader market picture.
Top Tip: Explore new board layouts in the Kraken Desktop dashboard gallery.
Ready to elevate your trading?
With the real-time comparison charts feature, Kraken Desktop puts unparalleled analytical power right at your fingertips. Whether you’re a seasoned trader or just getting started, you’ll appreciate the flexibility and precision that this new feature brings to your trading toolkit.
Availability of Kraken Desktop is subject to certain limitations and eligibility criteria. These materials are for general information purposes only and are not investment advice or a recommendation or solicitation to buy, sell, stake, or hold any cryptoasset or to engage in any specific trading strategy. Kraken makes no representation or warranty of any kind, express or implied, as to the accuracy, completeness, timeliness, suitability or validity of any such information and will not be liable for any errors, omissions, or delays in this information or any losses, injuries, or damages arising from its display or use. Kraken does not and will not work to increase or decrease the price of any particular cryptoasset it makes available. Some crypto products and markets are regulated and others are unregulated; regardless, Kraken may or may not be required to be registered or otherwise authorised to provide specific products and services in each market, and you may not be protected by government compensation and/or regulatory protection schemes. The unpredictable nature of the crypto-asset markets can lead to loss of funds. Tax may be payable on any return and/or on any increase in the value of your cryptoassets and you should seek independent advice on your taxation position. Geographic restrictions may apply. See Legal Disclosures for each jurisdiction here.
The provision of any services via Kraken Desktop, including, but not limited to, services to connect to, trade on, view market data, or otherwise interact with the Kraken platform, and the display of any content via Kraken Desktop, is subject to the Kraken Terms and Conditions.
The post Introducing multi-market price comparison charts on Kraken Desktop appeared first on Kraken Blog.
Kraken Blog


