GoChain (GO) Price Prediction 2023 – 2030
GoChain is one of those incredibly innovative tokens that have a solid technical foundation and a respectable list of partnerships but haven’t managed to make a breakthrough yet.
As a smaller token, it doesn’t have a fixed ranking spot in the market cap-based ratings, such as CoinMarketCap or CoinGecko — it stays somewhere in the 500-700 range. Many coins and tokens with a similar position have a market capitalization that is not that different from their “neighbors.” That’s why their spots in the ranking can fluctuate wildly within one day.
Despite that, GoChain can still be a worthwhile investment for certain investors. As a smaller token, GO is a relatively risky choice, but it also has high profit potential. In this article, we will attempt to make a GoChain price forecast for 2022-2030, but please remember that only you can decide whether an asset will be a good fit for your portfolio or not.
GoChain Overview
Our real-time GO to USD price update shows the current Gochain price as $0.0050 USD.
According to our Gochain price prediction, GO price is expected to have a -1.49% decrease and drop as low as by December 25, 2023.
Our analysis of the technical indicators suggests that the current market feeling is Bearish Bearish 52%, with a Fear & Greed Index score of 70 (Greed).
Over the last 30 days, Gochain has had 15/30 (50%) green days and 9.72% price volatility.
Gochain (GO) Technical Overview
When discussing future trading opportunities of digital assets, it is essential to pay attention to market sentiments.
Gochain Profit Calculator
Currencies
Gochain (GO) Price Prediction For Today, Tomorrow and Next 30 Days
Date
Price
Change
December 24, 2023$0.004905-1.47%December 25, 2023$0.004836-2.85%December 26, 2023$0.004904-1.49%December 27, 2023$0.004917-1.23%December 28, 2023$0.004787-3.84%December 29, 2023$0.004776-4.06%December 30, 2023$0.004746-4.66%December 31, 2023$0.004679-6.01%January 01, 2024$0.004702-5.54%January 02, 2024$0.004889-1.79%January 03, 2024$0.0050441.33%January 04, 2024$0.004963-0.3%January 05, 2024$0.0050721.89%January 06, 2024$0.0051423.29%January 07, 2024$0.0053437.33%January 08, 2024$0.00568314.16%January 09, 2024$0.00585317.58%January 10, 2024$0.00579016.31%January 11, 2024$0.00552110.91%January 12, 2024$0.00595319.59%January 13, 2024$0.00604021.33%January 14, 2024$0.00577015.91%January 15, 2024$0.00567614.02%January 16, 2024$0.00554311.35%January 17, 2024$0.00562212.94%January 18, 2024$0.00568514.2%January 19, 2024$0.00559312.35%January 20, 2024$0.00550110.51%January 21, 2024$0.00567313.96%January 22, 2024$0.00553811.25%
GoChain Prediction Table
Month
Minimum Price
Average Price
Maximum Price
Potential ROI
December
$0.00468
$0.00480
$0.00492
All Time
$0.00468
$0.00480
$0.00492
Month
Minimum Price
Average Price
Maximum Price
Potential ROI
January
$0.00473
$0.00531
$0.00502
February
$0.00472
$0.00570
$0.00521
March
$0.00470
$0.00609
$0.00539
April
$0.00469
$0.00648
$0.00558
May
$0.00467
$0.00687
$0.00577
June
$0.00466
$0.00726
$0.00596
July
$0.00464
$0.00765
$0.00614
August
$0.00462
$0.00804
$0.00633
September
$0.00461
$0.00843
$0.00652
October
$0.00459
$0.00882
$0.00671
November
$0.00458
$0.00921
$0.00689
December
$0.00456
$0.00960
$0.00708
All Time
$0.00465
$0.00746
$0.00605
Month
Minimum Price
Average Price
Maximum Price
Potential ROI
January
$0.00509
$0.00974
$0.00760
February
$0.00562
$0.00988
$0.00812
March
$0.00615
$0.0100
$0.00864
April
$0.00667
$0.0102
$0.00915
May
$0.00720
$0.0103
$0.00967
June
$0.00773
$0.0105
$0.0102
July
$0.00826
$0.0106
$0.0107
August
$0.00879
$0.0107
$0.0112
September
$0.00932
$0.0109
$0.0117
October
$0.00984
$0.0110
$0.0123
November
$0.0104
$0.0112
$0.0128
December
$0.0109
$0.0113
$0.0133
All Time
$0.00799
$0.0105
$0.0104
Month
Minimum Price
Average Price
Maximum Price
Potential ROI
January
$0.0114
$0.0118
$0.0138
February
$0.0119
$0.0123
$0.0143
March
$0.0124
$0.0128
$0.0147
April
$0.0128
$0.0133
$0.0152
May
$0.0133
$0.0138
$0.0157
June
$0.0138
$0.0143
$0.0162
July
$0.0143
$0.0148
$0.0166
August
$0.0148
$0.0153
$0.0171
September
$0.0153
$0.0158
$0.0176
October
$0.0157
$0.0163
$0.0181
November
$0.0162
$0.0168
$0.0185
December
$0.0167
$0.0173
$0.0190
All Time
$0.0140
$0.0146
$0.0164
Month
Minimum Price
Average Price
Maximum Price
Potential ROI
January
$0.0173
$0.0180
$0.0198
February
$0.0180
$0.0186
$0.0206
March
$0.0186
$0.0193
$0.0214
April
$0.0193
$0.0199
$0.0222
May
$0.0199
$0.0206
$0.0230
June
$0.0206
$0.0212
$0.0238
July
$0.0212
$0.0219
$0.0245
August
$0.0218
$0.0225
$0.0253
September
$0.0225
$0.0232
$0.0261
October
$0.0231
$0.0238
$0.0269
November
$0.0238
$0.0245
$0.0277
December
$0.0244
$0.0251
$0.0285
All Time
$0.0209
$0.0215
$0.0241
Month
Minimum Price
Average Price
Maximum Price
Potential ROI
January
$0.0253
$0.0260
$0.0297
February
$0.0261
$0.0269
$0.0308
March
$0.0270
$0.0278
$0.0320
April
$0.0278
$0.0287
$0.0332
May
$0.0287
$0.0296
$0.0343
June
$0.0296
$0.0305
$0.0355
July
$0.0304
$0.0313
$0.0367
August
$0.0313
$0.0322
$0.0378
September
$0.0321
$0.0331
$0.0390
October
$0.0330
$0.0340
$0.0402
November
$0.0338
$0.0349
$0.0413
December
$0.0347
$0.0358
$0.0425
All Time
$0.0300
$0.0309
$0.0361
Month
Minimum Price
Average Price
Maximum Price
Potential ROI
January
$0.0358
$0.0369
$0.0439
February
$0.0369
$0.0380
$0.0453
March
$0.0379
$0.0391
$0.0467
April
$0.0390
$0.0402
$0.0480
May
$0.0401
$0.0413
$0.0494
June
$0.0412
$0.0424
$0.0508
July
$0.0422
$0.0435
$0.0522
August
$0.0433
$0.0446
$0.0536
September
$0.0444
$0.0457
$0.0550
October
$0.0455
$0.0468
$0.0563
November
$0.0465
$0.0479
$0.0577
December
$0.0476
$0.0490
$0.0591
All Time
$0.0417
$0.0430
$0.0515
Month
Minimum Price
Average Price
Maximum Price
Potential ROI
January
$0.0496
$0.0511
$0.0611
February
$0.0517
$0.0532
$0.0632
March
$0.0537
$0.0553
$0.0652
April
$0.0557
$0.0573
$0.0672
May
$0.0578
$0.0594
$0.0692
June
$0.0598
$0.0615
$0.0713
July
$0.0618
$0.0636
$0.0733
August
$0.0639
$0.0657
$0.0753
September
$0.0659
$0.0678
$0.0773
October
$0.0679
$0.0698
$0.0794
November
$0.0700
$0.0719
$0.0814
December
$0.0720
$0.0740
$0.0834
All Time
$0.0608
$0.0625
$0.0723
Month
Minimum Price
Average Price
Maximum Price
Potential ROI
January
$0.0745
$0.0766
$0.0870
February
$0.0771
$0.0793
$0.0907
March
$0.0796
$0.0819
$0.0943
April
$0.0822
$0.0845
$0.0979
May
$0.0847
$0.0871
$0.102
June
$0.0873
$0.0898
$0.105
July
$0.0898
$0.0924
$0.109
August
$0.0923
$0.0950
$0.112
September
$0.0949
$0.0976
$0.116
October
$0.0974
$0.100
$0.120
November
$0.1000
$0.103
$0.123
December
$0.103
$0.106
$0.127
All Time
$0.0885
$0.0911
$0.107
Month
Minimum Price
Average Price
Maximum Price
Potential ROI
January
$0.106
$0.109
$0.131
February
$0.109
$0.112
$0.135
March
$0.112
$0.116
$0.139
April
$0.116
$0.119
$0.143
May
$0.119
$0.123
$0.146
June
$0.122
$0.126
$0.150
July
$0.126
$0.130
$0.154
August
$0.129
$0.133
$0.158
September
$0.132
$0.137
$0.162
October
$0.136
$0.140
$0.166
November
$0.139
$0.144
$0.170
December
$0.142
$0.147
$0.174
All Time
$0.124
$0.128
$0.152
GoChain Historical
According to the latest data gathered, the current price of GoChain is $$0.01, and GO is presently ranked No. 1075 in the entire crypto ecosystem. The circulation supply of GoChain is $6,535,434.52, with a market cap of 1,247,519,986 GO.
In the past 24 hours, the crypto has increased by $0.00010 in its current value.
For the last 7 days, GO has been in a good upward trend, thus increasing by 2.47%. GoChain has shown very strong potential lately, and this could be a good opportunity to dig right in and invest.
During the last month, the price of GO has increased by 19.71%, adding a colossal average amount of $0.0010 to its current value. This sudden growth means that the coin can become a solid asset now if it continues to grow.
GoChain Price Prediction 2023
According to the technical analysis of GoChain prices expected in 2023, the minimum cost of GoChain will be $$0.00475. The maximum level that the GO price can reach is $$0.00483. The average trading price is expected around $$0.00492.
GO Price Forecast for December 2023
Based on the price fluctuations of GoChain at the beginning of 2023, crypto experts expect the average GO rate of $$0.00480 in December 2023. Its minimum and maximum prices can be expected at $$0.00468 and at $$0.00492, respectively.
GoChain Price Prediction 2024
After the analysis of the prices of GoChain in previous years, it is assumed that in 2024, the minimum price of GoChain will be around $$0.00456. The maximum expected GO price may be around $$0.00708. On average, the trading price might be $$0.00960 in 2024.
Month
Minimum Price
Average Price
Maximum Price
January 2024
$0.00473
$0.00531
$0.00502
February 2024
$0.00472
$0.00570
$0.00521
March 2024
$0.00470
$0.00609
$0.00539
April 2024
$0.00469
$0.00648
$0.00558
May 2024
$0.00467
$0.00687
$0.00577
June 2024
$0.00466
$0.00726
$0.00596
July 2024
$0.00464
$0.00765
$0.00614
August 2024
$0.00462
$0.00804
$0.00633
September 2024
$0.00461
$0.00843
$0.00652
October 2024
$0.00459
$0.00882
$0.00671
November 2024
$0.00458
$0.00921
$0.00689
December 2024
$0.00456
$0.00960
$0.00708
GoChain Price Prediction 2025
Based on the technical analysis by cryptocurrency experts regarding the prices of GoChain, in 2025, GO is expected to have the following minimum and maximum prices: about $$0.0109 and $$0.0133, respectively. The average expected trading cost is $$0.0113.
Month
Minimum Price
Average Price
Maximum Price
January 2025
$0.00509
$0.00974
$0.00760
February 2025
$0.00562
$0.00988
$0.00812
March 2025
$0.00615
$0.0100
$0.00864
April 2025
$0.00667
$0.0102
$0.00915
May 2025
$0.00720
$0.0103
$0.00967
June 2025
$0.00773
$0.0105
$0.0102
July 2025
$0.00826
$0.0106
$0.0107
August 2025
$0.00879
$0.0107
$0.0112
September 2025
$0.00932
$0.0109
$0.0117
October 2025
$0.00984
$0.0110
$0.0123
November 2025
$0.0104
$0.0112
$0.0128
December 2025
$0.0109
$0.0113
$0.0133
GoChain Price Prediction 2026
The experts in the field of cryptocurrency have analyzed the prices of GoChain and their fluctuations during the previous years. It is assumed that in 2026, the minimum GO price might drop to $$0.0167, while its maximum can reach $$0.0190. On average, the trading cost will be around $$0.0173.
Month
Minimum Price
Average Price
Maximum Price
January 2026
$0.0114
$0.0118
$0.0138
February 2026
$0.0119
$0.0123
$0.0143
March 2026
$0.0124
$0.0128
$0.0147
April 2026
$0.0128
$0.0133
$0.0152
May 2026
$0.0133
$0.0138
$0.0157
June 2026
$0.0138
$0.0143
$0.0162
July 2026
$0.0143
$0.0148
$0.0166
August 2026
$0.0148
$0.0153
$0.0171
September 2026
$0.0153
$0.0158
$0.0176
October 2026
$0.0157
$0.0163
$0.0181
November 2026
$0.0162
$0.0168
$0.0185
December 2026
$0.0167
$0.0173
$0.0190
GoChain Price Prediction 2027
Based on the analysis of the costs of GoChain by crypto experts, the following maximum and minimum GO prices are expected in 2027: $$0.0285 and $$0.0244. On average, it will be traded at $$0.0251.
Month
Minimum Price
Average Price
Maximum Price
January 2027
$0.0173
$0.0180
$0.0198
February 2027
$0.0180
$0.0186
$0.0206
March 2027
$0.0186
$0.0193
$0.0214
April 2027
$0.0193
$0.0199
$0.0222
May 2027
$0.0199
$0.0206
$0.0230
June 2027
$0.0206
$0.0212
$0.0238
July 2027
$0.0212
$0.0219
$0.0245
August 2027
$0.0218
$0.0225
$0.0253
September 2027
$0.0225
$0.0232
$0.0261
October 2027
$0.0231
$0.0238
$0.0269
November 2027
$0.0238
$0.0245
$0.0277
December 2027
$0.0244
$0.0251
$0.0285
GoChain Price Prediction 2028
Crypto experts are constantly analyzing the fluctuations of GoChain. Based on their predictions, the estimated average GO price will be around $$0.0358. It might drop to a minimum of $$0.0347, but it still might reach $$0.0425 throughout 2028.
Month
Minimum Price
Average Price
Maximum Price
January 2028
$0.0253
$0.0260
$0.0297
February 2028
$0.0261
$0.0269
$0.0308
March 2028
$0.0270
$0.0278
$0.0320
April 2028
$0.0278
$0.0287
$0.0332
May 2028
$0.0287
$0.0296
$0.0343
June 2028
$0.0296
$0.0305
$0.0355
July 2028
$0.0304
$0.0313
$0.0367
August 2028
$0.0313
$0.0322
$0.0378
September 2028
$0.0321
$0.0331
$0.0390
October 2028
$0.0330
$0.0340
$0.0402
November 2028
$0.0338
$0.0349
$0.0413
December 2028
$0.0347
$0.0358
$0.0425
GoChain Price Prediction 2029
Every year, cryptocurrency experts prepare forecasts for the price of GoChain. It is estimated that GO will be traded between $$0.0476 and $$0.0591 in 2029. Its average cost is expected at around $$0.0490 during the year.
Month
Minimum Price
Average Price
Maximum Price
January 2029
$0.0358
$0.0369
$0.0439
February 2029
$0.0369
$0.0380
$0.0453
March 2029
$0.0379
$0.0391
$0.0467
April 2029
$0.0390
$0.0402
$0.0480
May 2029
$0.0401
$0.0413
$0.0494
June 2029
$0.0412
$0.0424
$0.0508
July 2029
$0.0422
$0.0435
$0.0522
August 2029
$0.0433
$0.0446
$0.0536
September 2029
$0.0444
$0.0457
$0.0550
October 2029
$0.0455
$0.0468
$0.0563
November 2029
$0.0465
$0.0479
$0.0577
December 2029
$0.0476
$0.0490
$0.0591
GoChain Price Prediction 2030
Cryptocurrency analysts are ready to announce their estimations of the GoChain’s price. The year 2030 will be determined by the maximum GO price of $$0.0834. However, its rate might drop to around $$0.0720. So, the expected average trading price is $$0.0740.
Month
Minimum Price
Average Price
Maximum Price
January 2030
$0.0496
$0.0511
$0.0611
February 2030
$0.0517
$0.0532
$0.0632
March 2030
$0.0537
$0.0553
$0.0652
April 2030
$0.0557
$0.0573
$0.0672
May 2030
$0.0578
$0.0594
$0.0692
June 2030
$0.0598
$0.0615
$0.0713
July 2030
$0.0618
$0.0636
$0.0733
August 2030
$0.0639
$0.0657
$0.0753
September 2030
$0.0659
$0.0678
$0.0773
October 2030
$0.0679
$0.0698
$0.0794
November 2030
$0.0700
$0.0719
$0.0814
December 2030
$0.0720
$0.0740
$0.0834
GoChain Price Prediction 2031
After years of analysis of the GoChain price, crypto experts are ready to provide their GO cost estimation for 2031. It will be traded for at least $$0.1025, with the possible maximum peaks at $$0.1269. Therefore, on average, you can expect the GO price to be around $$0.1055 in 2031.
Month
Minimum Price
Average Price
Maximum Price
January 2031
$0.0745
$0.0766
$0.0870
February 2031
$0.0771
$0.0793
$0.0907
March 2031
$0.0796
$0.0819
$0.0943
April 2031
$0.0822
$0.0845
$0.0979
May 2031
$0.0847
$0.0871
$0.102
June 2031
$0.0873
$0.0898
$0.105
July 2031
$0.0898
$0.0924
$0.109
August 2031
$0.0923
$0.0950
$0.112
September 2031
$0.0949
$0.0976
$0.116
October 2031
$0.0974
$0.100
$0.120
November 2031
$0.1000
$0.103
$0.123
December 2031
$0.103
$0.106
$0.127
GoChain Price Prediction 2032
Cryptocurrency analysts are ready to announce their estimations of the GoChain’s price. The year 2032 will be determined by the maximum GO price of $$0.1739. However, its rate might drop to around $$0.1421. So, the expected average trading price is $$0.1474.
Month
Minimum Price
Average Price
Maximum Price
January 2032
$0.106
$0.109
$0.131
February 2032
$0.109
$0.112
$0.135
March 2032
$0.112
$0.116
$0.139
April 2032
$0.116
$0.119
$0.143
May 2032
$0.119
$0.123
$0.146
June 2032
$0.122
$0.126
$0.150
July 2032
$0.126
$0.130
$0.154
August 2032
$0.129
$0.133
$0.158
September 2032
$0.132
$0.137
$0.162
October 2032
$0.136
$0.140
$0.166
November 2032
$0.139
$0.144
$0.170
December 2032
$0.142
$0.147
$0.174
GoChain, or Go Chain, as it is also sometimes spelled, is one of the greenest and fastest cryptocurrencies in the world. Additionally, it is also considered to be among the most cost-effective tokens: its transactions are up to 1,000 times cheaper than those of the most popular digital currencies like Bitcoin or Ethereum. The average transaction confirmation time for GO is 3-5 seconds.
The GO token powers the GoChain network, which utilizes one of the most innovative consensus algorithms in the world — namely, proof-of-reputation. This novel algorithm uses a reputation-based system for maintaining the safety and security of the blockchain system. According to its creators, one of the greatest risks of peer-to-peer networks is the ability of nodes to come and go at will. So, PoR only allows the nodes with the highest reputation values to join the consensus group that can make the decisions pertaining to the state of the blockchain.
On February 23, 2022, the GoChain network introduced staking: 50% of all GO rewards now go to the stakers.
In order to buy the GoChain cryptocurrency, first, you will need to get a crypto wallet that supports it. Some of the hardware and hot wallets that support it are MetaMask, Ledger, Trezor, MEW, and others — you can see the full list on the GoChain website.
Can’t load widget
The GoChain cryptocurrency has some things backing it up, but there are also a few factors that seem to be pointing toward GO having a rather hard time in the near future.
First of all, its official Reddit community is all but dead — in all the recent posts, there are just people begging for 1 GO to be able to transfer their OMI tokens. Secondly, users from the US are currently having difficulties obtaining GO. Additionally, a prominent project that used the GoChain network — the VeVe marketplace and its token OMI — has recently moved to the Ethereum blockchain.
On the other hand, GoChain remains a highly effective and eco-friendly blockchain platform. It also has its own NFT marketplace, Zeromint.
GoChain’s price and the future of the project will largely depend on how many partnerships its team will manage to establish in the near future. There’s a huge possibility that the current (as of the end of February 2022) instability may bring a lot of new investors to the market, and it will be up to GO’s team to figure out ways to attract them to this project. The project’s eco-friendliness surely is a huge advantage.
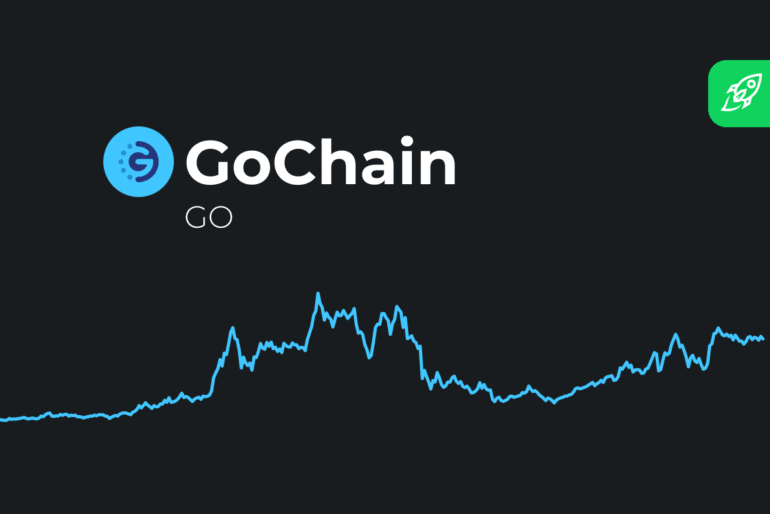
Source: CoinMarketCap
As can be seen from the chart, GoChain’s price follows the rest of the cryptocurrency market. Therefore, it is likely to rise alongside other cryptocurrencies in the future, too.
As of the end of February 2022, most experts are bullish on GoChain and expect the GO price to go up in the near future. Most GoChain price predictions at the moment are positive and expect at least a 40% growth in one year.
GoChain Forecast for 2022-2030
Please enable JavaScript in your browser to complete this form.
If GO withstands the test of time and manages to stay afloat amid incredibly tight competition and inevitable government regulations, then we will likely see its average price continuing to rise. For now, our tentative GoChain price prediction for 2030 will be an average of $0.07 per token. Of course, there will also be drops and price spikes: if you’re planning to invest in this token, we recommend exercising caution and doing your best not to make irrational decisions due to market hype and FOMO.
Is GoChain a Good Investment?
It is hard to predict whether GoChain will be a profitable investment or not. A lot depends on when you buy it or sell it and so on. Most cryptocurrencies rise eventually, and GoChain’s price has the potential to go up in the future.
We cannot give you investment advice — you will need to do your own research in order to determine how good of an investment GoChain will be. Remember that it is very much a high-risk, high-reward investment, and we would recommend against investing in it if you already have many similar assets in your portfolio.
What Is the Future of GoChain?
So, can GO still go to the moon? It is possible. Although it is not as likely as, say, for some other coins or tokens like SHIB or Solana, it is definitely not beyond the realm of possibility. Currently, we expect GoChain’s price to mirror the rest of the crypto market closely. While many people are waiting for its “bubble” to pop, we think that is not likely to happen in the near future or at all.
You can buy GoChain on its official website or one of the many exchanges that support it. Unfortunately, it is not listed on Changelly, but you can use our platform to buy BTC, ETH, or another cryptocurrency that can be later used to purchase GO.
Disclaimer: Please note that the contents of this article are not financial or investing advice. The information provided in this article is the author’s opinion only and should not be considered as offering trading or investing recommendations. We do not make any warranties about the completeness, reliability and accuracy of this information. The cryptocurrency market suffers from high volatility and occasional arbitrary movements. Any investor, trader, or regular crypto users should research multiple viewpoints and be familiar with all local regulations before committing to an investment.
The post GoChain (GO) Price Prediction 2023 – 2030 appeared first on Cryptocurrency News & Trading Tips – Crypto Blog by Changelly.
Cryptocurrency News & Trading Tips – Crypto Blog by Changelly