September ‘crash’ to $22K? — 5 things to know in Bitcoin this week

Bitcoin (BTC) starts a new week struggling with $26,000 as August becomes its worst month of 2023.
BTC price strength remains dubious after a snap crash 10 days ago, with bulls unable to wrestle back control of the market to provide a relief bounce.
The outlook is similarly uncertain, with September traditionally a poorly performing month for Bitcoin, and with the August monthly close just days away, could another downside surprise lie in store?
Macro triggers are again taking a back seat this week, with Personal Consumption Expenditures (PCE) Index data the highlight in what is otherwise a cool week for crypto contagion.
That said, traders and analysts are on their toes, and with no hint of a rebound in sight, many are still braced for worse to come.
Cointelegraph takes a look at the main BTC price performance talking points for the week ahead.
BTC price sags with monthly close in sight
There are no prizes for guessing how Bitcoin ended its latest weekly candle, especially with prior knowledge of previous closes.
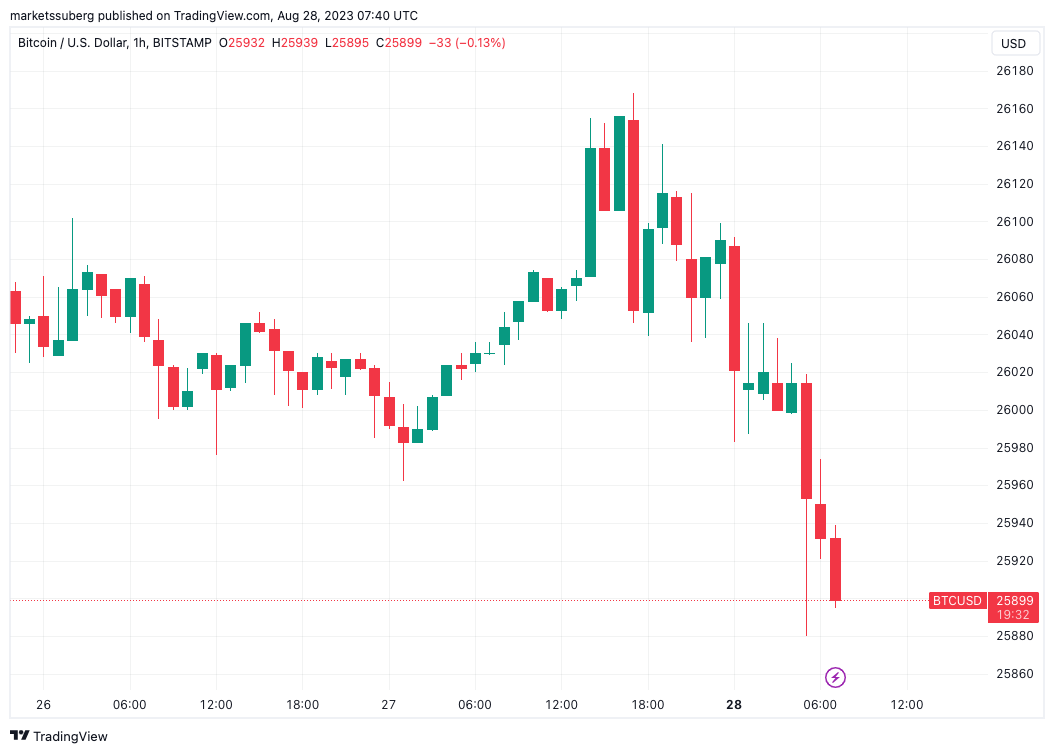
Despite holding $26,000 into the close, BTC/USD immediately went downhill after that, wicking to $25,880 before consolidating slightly higher, data from Cointelegraph Markets Pro and TradingView shows.

That marked multiday lows, part of what popular trader Skew forecasted could be pressure from shorters into the new week.
“Shorts continue to stack into the weekend, expecting some kind of move around US Futures open and into Monday EU session,” part of X (formerly Twitter) analysis read.
Skew additionally described weekend BTC behavior as “max pain price action.”
The monthly close was a key topic for market participants, with volatility on the cards after August produced 11% losses.
Keith Alan, co-founder of monitoring resource Material Indicators, predicted a trip to multimonth lows.
“Whales aren’t buying yet, and neither am I,” he commented alongside a chart of the Binance BTC/USD order book.
“Expecting volatility to continue through the monthly candle close. Patiently waiting to test the local low.”
In addition to low whale order volume, the accompanying order book chart showed a lack of bid liquidity overall, with $25,500 gaining only modest interest.

“I am looking for a trigger to enter where we drop to $25,000 lows, reclaim and pump,” popular trader Crypto Tony agreed.
“Or if we flip $26,700 into support. No entry before that on #Bitcoin as we are just mid range, so no safe entry just yet.”

Beyond the downside, moving averages that previously acted as support before the crash may now have the opposite effect, popular trader and analyst Rekt Capital warned.
“The BTC bullish momentum moving averages may act as resistance,” he summarized alongside the weekly chart.

Further analysis hoped for a lower low construction to appear on weekly timeframes in what could be part of a “subtle rising wedge.”

August risks being worst in eight years
It is no secret that Bitcoin has underperformed this month — even by August standards, which have rarely given bulls anything to celebrate.
BTC/USD is down 11% this month, and with the weekly close around the corner, anticipation is building among market observers.
A look at comparative data from monitoring resource CoinGlass reveals that August 2023 is already vying with last year to become Bitcoin’s worst August since 2015. BTC price shed 13.9% in August 2022, a move which marked the beginning of half a year of pain.

However, some believe that September could easily end up almost as bad based on historical precedent.
“Could Bitcoin Crash to $22,000 In September?” Rekt Capital queried last week in part of an X post.
“To answer this question, we need to first focus on August. What was the worst BTC August drawdown in history? -17% in 2014 and -18% in 2015. Currently in 2023, $BTC is now down -16%. If BTC were to drop -18% this August, BTC would drop to ~$24700. But that might not be the end of the retrace.”
Continuing, Rekt Capital noted that September usually offers a “single-digit drawdown.” Against the backdrop of its recent double top on weekly timeframes, a $22,000 target lines up.
“So if BTC retraces, say, an additional -10% in September… That would mean price would drop to ~$22200,” he concluded.
“Then that would approximately match the Measured Move target for the Double Top breakdown of ~$22000.”

Bitcoin’s “longest bear market in history”
Analyzing year-on-year (YoY) percentage returns for BTC/USD, meanwhile, the true extent of the recent bear market becomes clear.
Michaël van de Poppe, founder and CEO of trading firm Eight, concluded that it has, in fact, been Bitcoin’s “longest bear market in history.”
“The current bear market is relatively comparable to what we’ve witnessed in 2015. A period of sideways action, where the faith in crypto is slowly getting lost too, despite the fact of solid fundamental growth,” he wrote in recent thoughts on the crypto market.
“Right now, price of Bitcoin is nowhere near the valuation of the peak in November ’21. It’s down more than 50% and in a bear market of 490 days.”
An accompanying chart compared the current 490-day negative YoY returns to previous periods, with 2015 lasting 386 days.
Van de Poppe added that even positive news events, such as the future green-lighting of the United States’ first Bitcoin spot price exchange-traded fund (ETF), had not yet entered market consciousness.
“The thing is, during the current period, these events are not being reflected in price at all,” he wrote.
“They lag behind as the market is stuck in the ‘bear market modus‘, as the past 2 years price has been falling.”

PCE data follows muted crypto Jackson Hole reaction
Bitcoin and altcoins have displayed precious little regard for macroeconomic developments in recent weeks.
Even Federal Reserve interest rate changes and data releases such as the Consumer Price Index (CPI) have had a barely perceptible impact on markets.
Last week’s comments from Fed Chair Jerome Powell at the annual Jackson Hole Economic Symposium continued the trend, even as CME Group’s FedWatch Tool showed bets of a pause in rate hikes beginning next month at above 80%.

This week, despite containing the Fed’s preferred inflation gauge in the form of PCE, could well end up no different.
PCE data is due on Aug. 31, hours before the Bitcoin monthly close, with Sep. 1 offering nonfarm payrolls and unemployment data.
Huge week for ALL things related to economic data, volatility is back.
Jobs, inflation, housing data and more.
We’re publishing our trades for the week shortly.
In 2022, our calls made 86%.
Subscribe to access our analysis and see what we’re trading:https://t.co/SJRZ4FrfLE
— The Kobeissi Letter (@KobeissiLetter) August 27, 2023
For macro markets, however, financial commentary resource The Kobeissi Letter promised an “action packed week.”
“Huge week for ALL things related to economic data, volatility is back,” it summarized in part of its latest X analysis.
Record hash rate reflects “miner bull run”
Could Bitcoin miners already be providing a silver lining for bulls into the end of the year?
Related: Bitcoin velocity hits lows last seen before Q4 2020 BTC price breakout
As Cointelegraph reported, one theory expects that Q4 will see miners bidding Bitcoin higher in preparation for the April 2024 block subsidy halving, which will cut their reward per mined block by 50%.
They should join “smart money” in doing so, creating a buzz of its own around the halving narrative, even if the broader market only tends to react to emission changes post-factum.
Continuing the debate, James Straten, research and data analyst at crypto insights firm CryptoSlate, noted that Bitcoin hash rate is already headed into uncharted territory.
“The Bitcoin hash rate just hit 400 th/s for the first time ever. It is mind-blowing, considering the energy issues in Texas and the cost of electricity surging worldwide,” he told X subscribers.
“This is the miner bull run leading up to the halving next year. Similar explosive hash rate growth that led up to the 2020 halving.”

Hash rate is an estimation of the processing power dedicated to mining, and while impossible to measure exactly, figures from on-chain analytics firm Glassnode show not only new all-time highs but a spate of upward adjustments contrasting with flat or downward-trending BTC price performance.
Last week, Bitcoin also saw one of its largest upward difficulty adjustments of 2023, taking the on-chain fundamental yardstick to all-time highs of its own.
This article does not contain investment advice or recommendations. Every investment and trading move involves risk, and readers should conduct their own research when making a decision.


