Price analysis 6/23: BTC, ETH, BNB, XRP, ADA, DOGE, SOL, MATIC, LTC, DOT

The rush to apply for a spot Bitcoin (BTC) exchange-traded fund (ETF) rejuvenated the bulls, but this news is likely to boost the price only to a certain distance. As the price moves up, the risks of a crash increase if none of the ETF applications are approved. Trading firm QCP Capital, for example, is not convinced that a spot ETF will see the light of day in the near term.
Another point of view came from Gemini co-founder Cameron Winklevoss, who said on June 21 that the “floodgates” for accumulating Bitcoin are “closing fast.” Similarly, MicroStrategy executive chairman Michael Saylor said that the opportunity to “front-run institutional demand for Bitcoin” was ending.

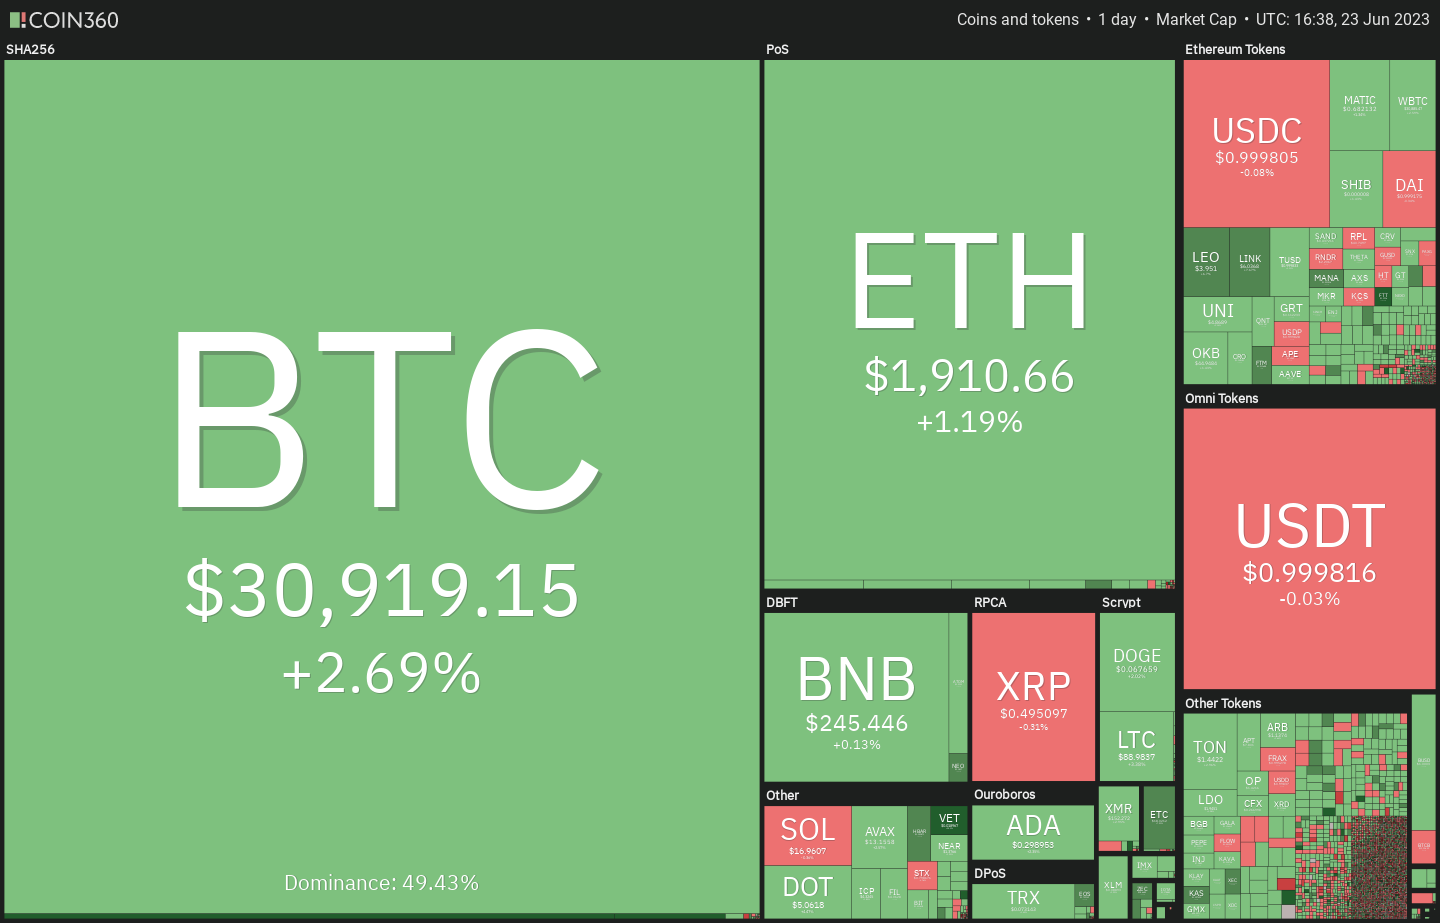
Bitcoin remains the center of attraction as its market dominance hovers near 50%. K33 Research analysis found that over the long term, Bitcoin investment has far outperformed an altcoin portfolio by a huge margin. Altcoins had their share of short-term outperformance in 2017 and again in 2021, but that could not sustain in the long term.
Could Bitcoin and the altcoins rise above their respective overhead resistance levels? Let’s study the charts of the top 10 cryptocurrencies to find out.
Bitcoin price analysis
Bitcoin (BTC) is facing resistance at the overhead resistance of $31,000, but the bulls have not ceded ground to the bears. This enhances the prospects of a break above $31,000.

The uncertainty of the June 22 Doji candlestick pattern resolved to the upside on June 23. Buyers will again try to sustain the price above $31,000. If they succeed, the BTC/USDT pair could first rise to $32,400 and thereafter make a dash toward the next major resistance at $40,000.
The 20-day exponential moving average, or EMA ($27,561), has turned up and the relative strength index (RSI) is in the overbought zone, indicating that bulls are in control. This view will be negated in the near term if the price sustains below $28,500. The pair could then enter a range-bound action between $31,000 and $24,800.
Ether price analysis
Ether (ETH) is attempting to resume its up-move. The bulls pushed the price above the overhead resistance of $1,928 on June 22 but could not sustain the higher levels.

The bulls purchased the intraday dips and have again sent the price to the overhead resistance at $1,928. If this level is scaled, it will suggest that lower levels are attracting buyers. That could enhance the prospect of a rally to $2,000 and then to $2,200.
Contrary to this assumption, if the price once again turns down and breaks below the moving averages, it will suggest that the bears are selling on rallies near $2,000. The ETH/USDT pair could then decline to 20-day EMA ($1,804).
BNB price analysis
BNB (BNB) turned down from the 20-day EMA ($255) on June 22, indicating that the sentiment remains negative and traders are selling on rallies.

The bears will try to pull the price to the first support at $230 and then to the vital support at $220. Sellers will have to tug the price below the support zone to signal the resumption of the downtrend.
On the contrary, if buyers drive the price above the 20-day EMA, it will suggest that the selling pressure is reducing. The BNB/USDT pair could then surge to the breakdown level of $265 and subsequently to the 61.8% Fibonacci retracement level of $272.
XRP price analysis
XRP’s (XRP) recovery picked up momentum on June 22, and the bulls kicked the price above the 20-day EMA ($0.49). However, the long wick on the day’s candlestick shows that the bears are unlikely to give up easily.

The flattish 20-day EMA and the RSI near the midpoint suggest a balance between supply and demand. That could keep the XRP/USDT pair between the 50-day SMA ($0.47) and the overhead resistance of $0.56 for a few days.
The next trending move could start after the bulls overcome the obstacle at $0.56 or the bears sink the price below $0.46. Until then, random range-bound price action is likely to continue.
Cardano price analysis
Cardano’s (ADA) long wick on the June 22 candlestick suggests that the bears are selling the rallies to this level.

But the bulls are in no mood to give up. They are again trying to thrust the price above the breakdown level of $0.30. If they can pull it off, it will suggest the start of a stronger recovery to the 50-day SMA ($0.34). The bears will again try to check the relief rally at this level.
Another possibility is that the price turns down sharply from the overhead resistance. Such a move would enhance the prospects of consolidation between $0.24 and $0.30. The bears will have to yank the ADA/USDT pair below $0.24 to start the next leg of the downtrend.
Dogecoin price analysis
Dogecoin (DOGE) turned down sharply from the overhead resistance of $0.07 on June 22, indicating that the bears are guarding the level with vigor.

The bulls are trying to sustain the price above the 20-day EMA ($0.06). If they manage to do that, the DOGE/USDT pair could again rise to $0.07. A break and close above this level will suggest that the bears are losing their grip. The pair may then climb to $0.08, which may prove to be a tough barrier to cross.
The 20-day EMA is the key support for the bulls to protect. If this level gives way, it will suggest that the pair may swing between $0.06 and $0.07 for some time.
Solana price analysis
The bulls pushed Solana’s SOL (SOL) above the 20-day EMA ($17) on June 21, but they could not sustain the higher levels. Sellers pulled the price back below the level on June 22.

The immediate support to watch for on the downside is $16.18. If the price remains above this level, the likelihood of a break above the 20-day EMA increases. The SOL/USDT pair could then rally to $18.70.
Instead, if the price turns down and breaks below $16.18, it will signal that the bulls have given up and are bailing out of their positions. That could risk a retest of the crucial support zone between $15.28 and $14.06.
Related: Bitcoin volatility takes a break as $31K BTC price yearly highs loom
Polygon price analysis
The bulls pushed Polygon’s MATIC (MATIC) above the breakdown level of $0.69 on June 22, but the long wick on the candlestick shows that the bears are trying to protect the level.

A minor positive in favor of the bulls is that they have not allowed the price to drift much lower from the overhead resistance. This suggests that the bulls are hanging on to their positions in expectation of a move higher.
If buyers propel and sustain the price above $0.69, it may start a stronger recovery to the 50-day SMA ($0.80). This level may again act as a hurdle, but if cleared, the MATIC/USDT pair may soar to $1.
Alternatively, if the price turns down from the overhead resistance and dips below $0.62, it will suggest that the pair may oscillate between $0.69 and $0.50 for a while longer.
Litecoin price analysis
The bears tried to make a comeback on June 21 and 22 by defending the 50-day SMA ($85), but the bulls kept up the buying pressure on Litecoin (LTC).

The 20-day EMA ($82) has started to turn up, and the RSI has jumped into positive territory, indicating that the bulls are in command. There is a minor resistance at $92, but if that is crossed, the LTC/USDT pair may rally to the zone between $96 and the resistance line.
If bears want to halt the upward march, they will have to quickly pull the price back below the 20-day EMA. If they do that, the pair may slide to $75.
Polkadot price analysis
The long wick on Polkadot’s (DOT) June 21 and 22 candlestick shows that the bears tried to halt the recovery, but the bulls were in the mood to relent.

The failure of the bears to sink the price below the 20-day EMA ($4.80) shows that the bulls are trying to flip this level into support. Buyers pushed the price to the breakdown level of $5.15, where the bears may again mount a strong defense. If bulls overcome this hurdle, the DOT/USDT pair could rise to $5.56 and then to the downtrend line.
Contrarily, if the price turns down from $5.15 and slips below the 20-day EMA, it will suggest that the bears are active at higher levels. That could keep the pair range-bound between $5.15 and $4.22 for a few days.
This article does not contain investment advice or recommendations. Every investment and trading move involves risk, and readers should conduct their own research when making a decision.
This article is for general information purposes and is not intended to be and should not be taken as legal or investment advice. The views, thoughts, and opinions expressed here are the author’s alone and do not necessarily reflect or represent the views and opinions of Cointelegraph.


