How to use Microsoft Power BI

https://docs.google.com/document/d/1U8Kh-BgDD575lb3Mj3Xyqjd8_F8x65-gQ_muiys5up8/edit (piks for this article are in this doc)
In today’s data-driven world, organizations of all sizes are inundated with vast amounts of information. Extracting actionable insights from this data can be overwhelming and time-consuming.
Microsoft Power BI is a powerful business intelligence tool that empowers users to transform raw data into meaningful visualizations and interactive reports. In this article, we will delve into the basics of Microsoft Power BI and guide you through the process of harnessing its capabilities to unlock the full potential of your data.
Understanding Microsoft Power BI
A cloud-based business analytics application, Microsoft Power BI is made to connect, process and visualize data rapidly and effectively. It provides a user-friendly interface that enables data manipulation for both expert and non-technical users without the need for complex coding knowledge. The tool is a popular option for organizations all around the world because of its smooth connection with other Microsoft products, such as Excel and Azure.
In Power BI Desktop, there are three views available to users:
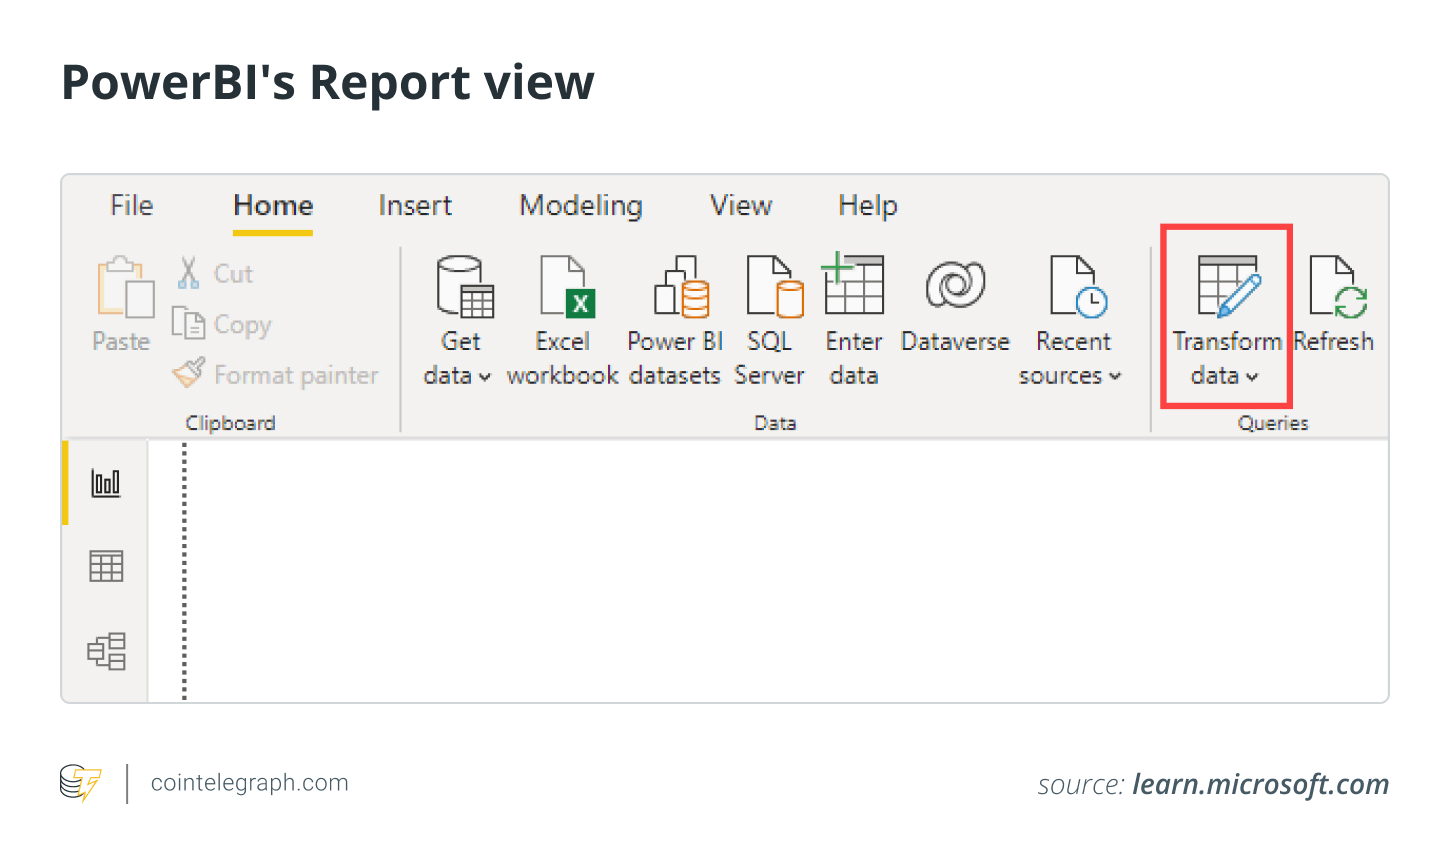
- Report view: Users can utilize their custom queries to construct visually appealing representations, arrange them as desired, and create multi-page reports that can be shared with others.
- Data view: This view provides a display of the report data in a data model format. Users can add measures, create new columns, and manage relationships between data elements.
- Model view: Users can access a graphical representation of the established relationships in the data model. Additionally, they have the option to manage and modify these relationships as necessary.

Related: How to use chatbots for virtual assistance
Getting started with Power BI
Data source connection
The first step is to connect Power BI to your data sources. It supports various data sources, including Excel spreadsheets, databases, cloud services and online platforms, such as Google Analytics. Once connected, Power BI will automatically refresh the data to ensure your reports are always up-to-date.

Data transformation and modeling
One might need to tidy up and format the data before they can visualize it. One can easily filter, sort, pivot and merge data tables using Power BI’s Power Query Editor. One can also create connections between various tables using the Data Modeling tool to facilitate in-depth research.


Creating interactive reports and dashboards using Power BI
Data visualization
With the data ready, Power BI’s rich collection of data visualization tools comes into play. One can create compelling charts, graphs, maps and tables that represent complex data in a comprehensible manner. The extensive library of customizable visuals ensures one finds the perfect representation for specific needs.

Building dashboards
Power BI dashboards are user-friendly one-page displays of visualizations and reports. One can combine different visual elements to create a holistic view of the data, making it easy to monitor key performance indicators (KPIs) and track business metrics in real-time.

Report publishing and sharing
After creating insightful reports and dashboards, one can publish them to the Power BI service. This cloud-based sharing platform allows users to securely share visualizations with colleagues, stakeholders or clients. Moreover, one can set up automatic data refresh schedules to keep the reports up-to-date.
Related: 15 important data terms you should know
Power BI’s advanced features and data analysis capabilities
Data analysis expressions
The data analysis expressions (DAX) language is a powerful formula language used in Power BI for data manipulation and calculations. By mastering DAX, one can create complex measures, calculated columns and tables that go beyond the built-in aggregation functions.
Additionally, DAX queries can be generated and executed using various tools, including SQL Server Management Studio (SSMS) and open-source applications, such as DAX Studio. Unlike DAX calculation formulas, which are limited to tabular data models, DAX queries can also be executed against Analysis Services Multidimensional models. DAX queries are commonly preferred due to their ease of writing and higher efficiency compared to Multidimensional Data Expressions (MDX) queries.
A DAX query resembles a statement, similar to a SELECT statement in T-SQL. The simplest form of a DAX query is an “evaluate” statement, as shown in the example below:

Power BI mobile app
Power BI’s mobile app extends the functionality to smartphones and tablets, enabling access to reports and dashboards on the go. Stay connected to the data and receive timely insights, regardless of the location.


