A sideways Bitcoin price could lead to breakouts in ETH, XRP, LDO and RNDR

Altcoin prices crumbled after the United States Securities and Exchange Commission (SEC) announced lawsuits against Binance and Coinbase at the start of the week. Apart from the action against the two biggest crypto exchanges, investors seem to be nervous because the SEC labeled 23 cryptocurrencies as securities in the two lawsuits. That brings the total number of cryptocurrencies termed as securities by the SEC to 67.
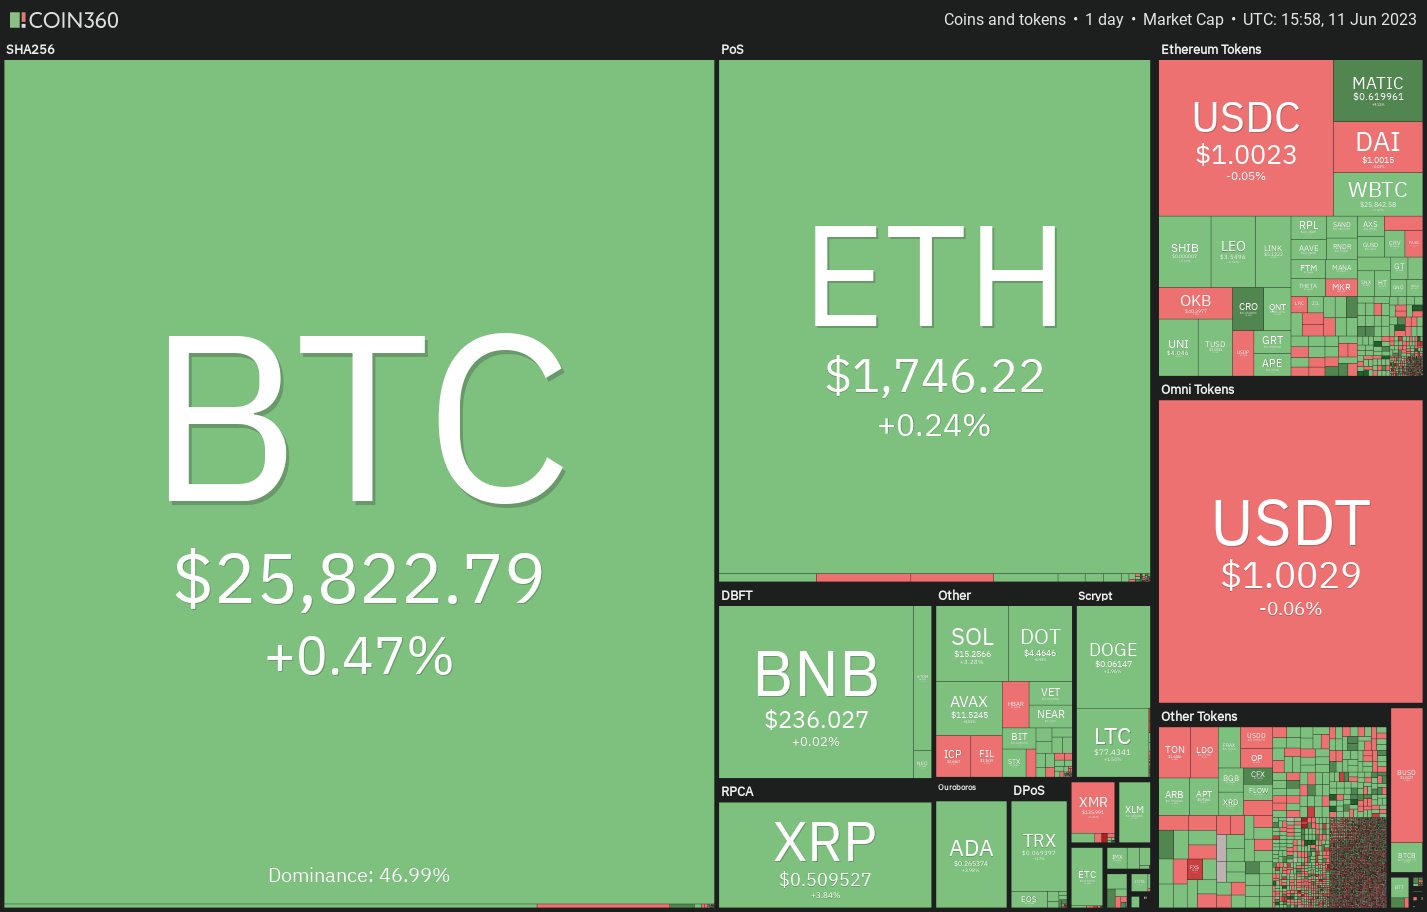
Among the mayhem, a minor positive is that Bitcoin (BTC) and Ether (ETH) have held out relatively well. This suggests that institutional investors are not panicking and dumping their positions. Due to their outperformance, Bitcoin’s dominance has risen to a year-to-date high of 47.6% and Ether’s to 20%.

The uncertainty in the near term is likely to keep several investors on the sidelines. During this period, the cryptocurrencies that have held out generally tend to do well when the market sentiment improves.
Let’s look at the top-5 cryptocurrencies that are trying to sustain above their respective support levels and are attempting to start a rebound. What are the important support and resistance levels to keep an eye on?
Bitcoin price analysis
Bitcoin once again dipped to the crucial support at $25,250 on June 10, indicating that the bears are keeping up the pressure. The repeated retest of a support level within short intervals tends to weaken it.

The downsloping moving averages and the relative strength index (RSI) in the negative territory indicate that bears are in control. If the support zone between $25,250 and $23,896 crumbles, the BTC/USDT pair may witness panic selling. The pair could then plummet to the psychologically vital level of $20,000. Buyers are expected to protect this level with all their might.
If bulls want to prevent a sharp decline, they will have to quickly push the price above the 20-day exponential moving average ($26,721). Such a move will suggest strong demand at lower levels. The pair may first rise to the 50-day simple moving average ($27,464) and thereafter to the resistance line of the channel. Buyers will have to kick the price above this level to indicate the resumption of the up-move.

The 4-hour chart shows that the recovery off the $25,250 support is facing selling at the 20-EMA. This indicates that the bears are not giving any opportunity to the bulls to make a comeback. The bears will have to sink the price below $25,250 to further solidify their position.
On the contrary, if the price turns up and breaks above the 20-EMA, the pair could rally to the 50-SMA. If this level gets taken out, the pair is likely to move toward $27,400.
Ether price analysis
Ether has been in a corrective phase for the past several days. The bears pulled the price below the 50% Fibonacci retracement level of $1,755 on June 10 but the bulls prevented a collapse as they defended the strong support at $1,700.

The bulls will try to start a relief rally that could reach the 20-day EMA ($1,835). This is an important level to watch out for because a break and close above it will suggest that the ETH/USDT pair may stay range-bound between $1,700 and $2,000 for some time.
Contrarily, sellers will try to stall the recovery and tug the price below the $1,700 support. If they can pull it off, the pair may start the next leg of the correction. There is a minor support at $1,600 but if it fails to hold, the pair may collapse to $1,352.

The 4-hour chart shows that the bulls had previously protected the $1,700 level with vigor and they may again try to do that. Buyers will have to cross the obstacles at the moving averages to start a sustained recovery that could take the price to $1,920.
On the contrary, if the price turns down from the current level or the moving averages, the bears will again try to sink the pair below $1,700. If they succeed, the selling may accelerate and the pair could retest $1,352.
XRP price analysis
XRP (XRP) turned down from the overhead resistance near $0.56 on June 10 and nosedived below the 20-day EMA ($0.50).

However, a positive sign is that the buyers promptly purchased the dip to the 50-day SMA ($0.47) as seen from the long tail on the day’s candlestick. The 20-day EMA is an important level for the bulls because if they sustain the price above it, the XRP/USDT pair may again reach near $0.56.
Instead, if the price turns down and breaks below the 20-day EMA, it will suggest that higher levels are attracting sellers. The pair may then drop to the 50-day SMA. A break and close below this level may start a deeper fall to $0.41.

The 4-hour chart shows that the recovery is facing selling near the 20-EMA. This suggests that the short-term sentiment remains negative and bears are selling on rallies. If the price turns down from the current level, the bears will try to yank the pair below $0.47. If they manage to do that, the pair may slide to $0.44.
On the other hand, if buyers thrust the price above the moving averages, it will clear the path for a possible rally to $0.55.
Related: The US will find the ‘right outcome’ for crypto, eventually — Coinbase CEO
Lido DAO price analysis
Lido DAO (LDO) has been falling inside a descending channel pattern for the past few days, indicating that the bears are in control.

The LDO/USDT pair plunged sharply on June 10 but the long tail on the day’s candlestick shows that the bulls are aggressively buying the dips to the support at $1.57. Buyers will try to start a recovery that may reach the moving averages.
However, the sellers are likely to have other plans. They would not want to give any leeway to the buyers and will try to sink the price to $1.57. If this level cracks, the pair may start its descent to the support line of the channel near $1.

The deeply oversold levels on the RSI suggest that a relief rally may be around the corner. Buyers tried to start a recovery but the bears did not allow the price to rise above $1.90. Hence, this becomes an important hurdle for the buyers to cross to start a recovery.
The pair could then rise to the 20-EMA where the bulls are likely to encounter strong selling by the bears. Buyers need to overcome this obstacle to start a stronger rally. This positive view will invalidate in the near term if the price plunges below $1.65.
Render Token price analysis
Render Token (RNDR) corrected sharply on June 10 and plunged below the uptrend line but a minor positive is that the bulls are trying to push the price back above the breakdown level.

If the price sustains above the uptrend line, it will suggest that the recent breakdown may have been a bear trap. The RNDR/USDT pair could then climb toward the 20-day EMA ($2.31) where it is likely to face its real test.
Alternatively, if the price fails to sustain above the uptrend line, it will suggest that the bears have flipped the uptrend line into resistance. The pair could then extend its decline and fall to the next support near $1.60.

The 4-hour chart shows that the bulls are trying to push the price back above the breakdown level but the bears have held their ground. The zone between the uptrend line and the 20-EMA remains the key level to keep an eye on. If the price breaks above this zone, the pair may recover to $2.40.
Contrarily, if the price continues lower from the current level and breaks below $1.80, it will signal the resumption of the downtrend. The pair may then drop to $1.60 where the buyers are likely to mount a strong defense.
This article does not contain investment advice or recommendations. Every investment and trading move involves risk, and readers should conduct their own research when making a decision.
This article is for general information purposes and is not intended to be and should not be taken as legal or investment advice. The views, thoughts, and opinions expressed here are the author’s alone and do not necessarily reflect or represent the views and opinions of Cointelegraph.

