The Ethereum Paradox: High Demand, Stagnant Price
 TL;DR
TL;DR
- Ethereum had one of the best performing months, the token rose over 50% in July.
- On a market-cap–adjusted basis, ETH has already attracted ~88% of BTC’s institutional demand (ETF + treasuries) but massively underperformed BTC since the ETF launch.
- July marks a regime shift: record ETF momentum, a 20-day ETF inflow streak, and corporate treasury buys that soaked up >2% of supply in a month.
- The divergence between record demand and price underperformance might continue to provide strong ETH performance and the catch up trade might be a gift for the mid-to-long-term traders.
ETH Institutional Demand Is Much Closer to BTC Than Headlines Suggest
U.S. spot Bitcoin ETFs began trading on January 11, 2024. At launch, Bitcoin traded near $47,000; today it is around $115,000. Cumulative net inflows total $55.06B, with an average daily inflow of $142.2M .
U.S. spot Ethereum ETFs launched on July 23, 2024. ETH traded near $3,500 at launch and is roughly $3,700 today—an increase of less than 10%. Cumulative net inflows have reached $9.62B, with $37.1M of average daily inflows.
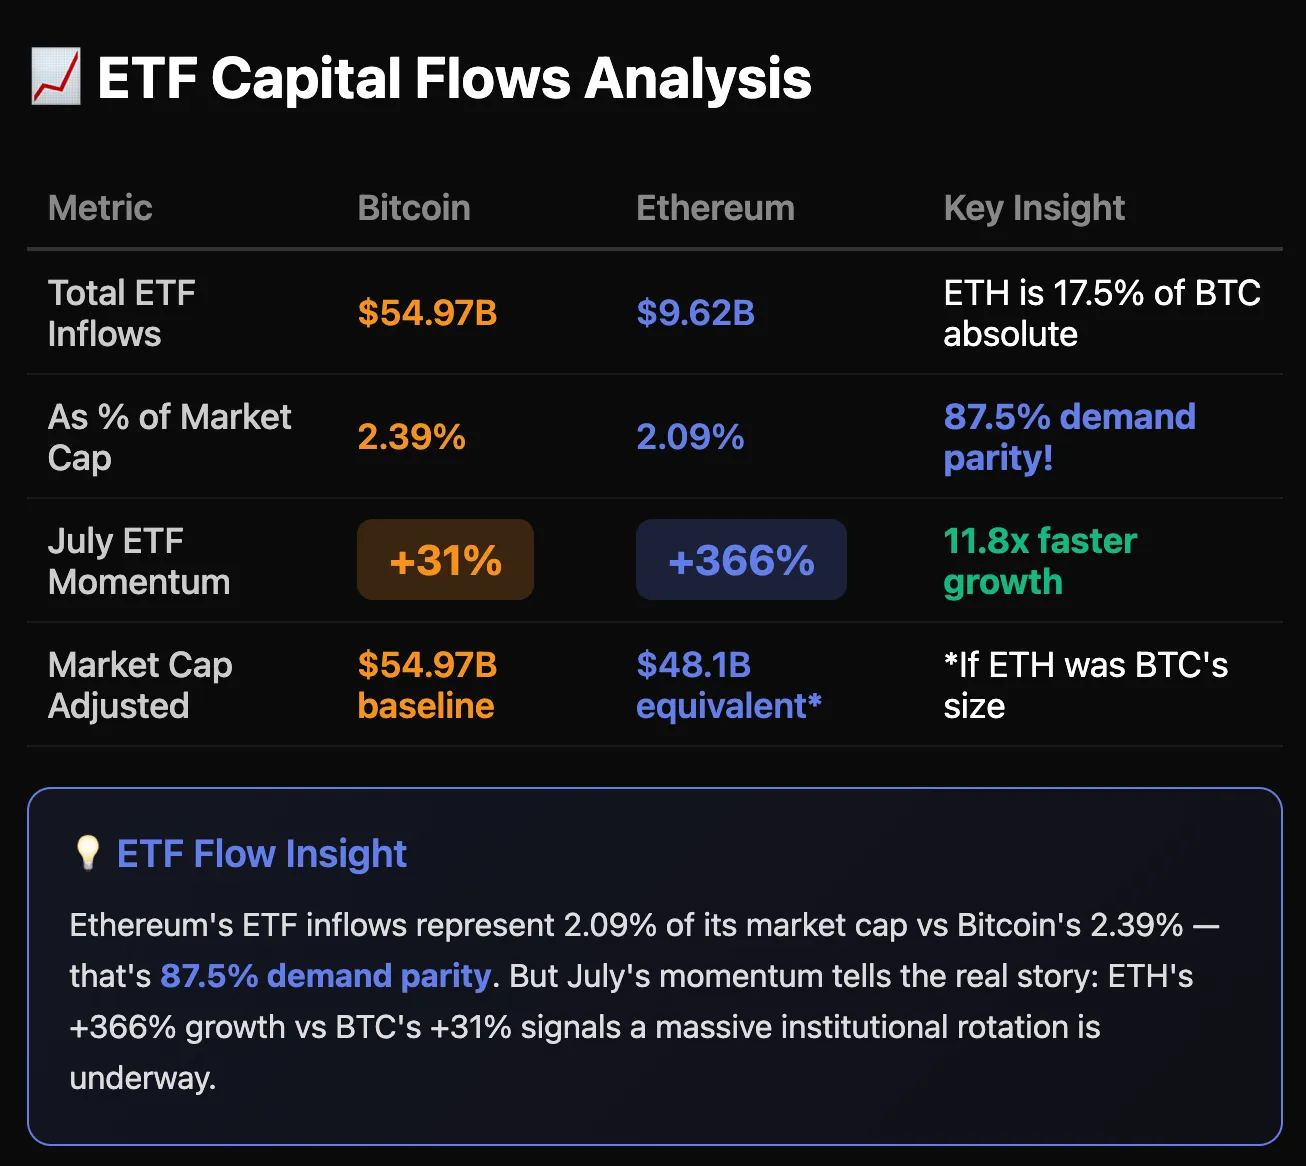 On the surface, BTC’s tradfi appearance seems to be far more successful than ETH. However, if we adjust for their market sizes, ETH’s tradfi demand is quickly catching up in July and is reaching parity. Bitcoin’s market cap is about $2.3T, while Ethereum’s is near $440B—roughly 1/5 the size. If you evaluate ETF flows as a percentage of each asset’s market capitalization, BTC sits near 2.4% and ETH near 2.1%. In other words, ETH’s ETF demand intensity is ~88% of BTC’s after a market cap adjustment. That is a very different picture from the raw totals and implies Ethereum is already attracting near-par institutional interest relative to its size.
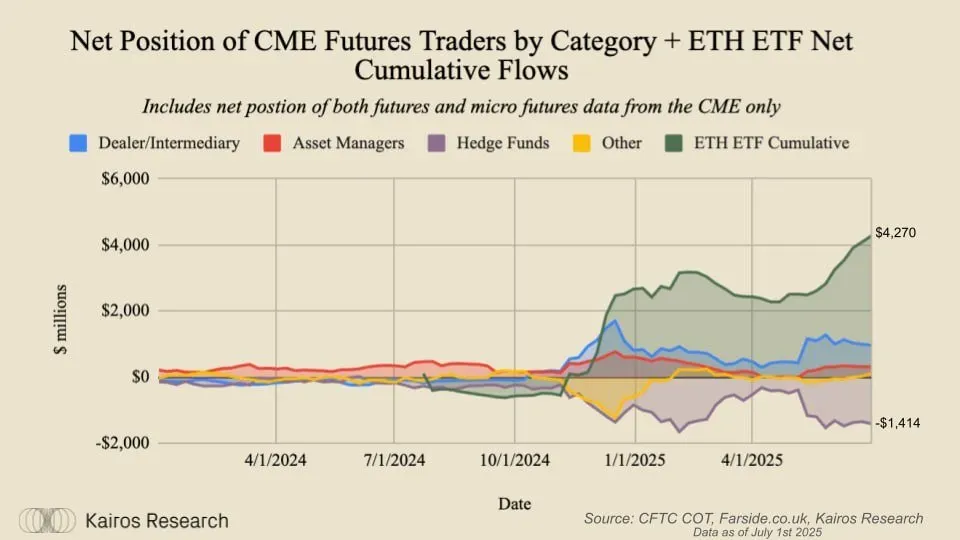
This point is reinforced by Kairos Research’s view that ETF creations represent real spot buying. According to their work, hedge-fund hedges account for only about one-third of ETF volume. The majority is outright exposure rather than synthetic or neutral positioning, which strengthens the link between sustained inflows and eventual price discovery.
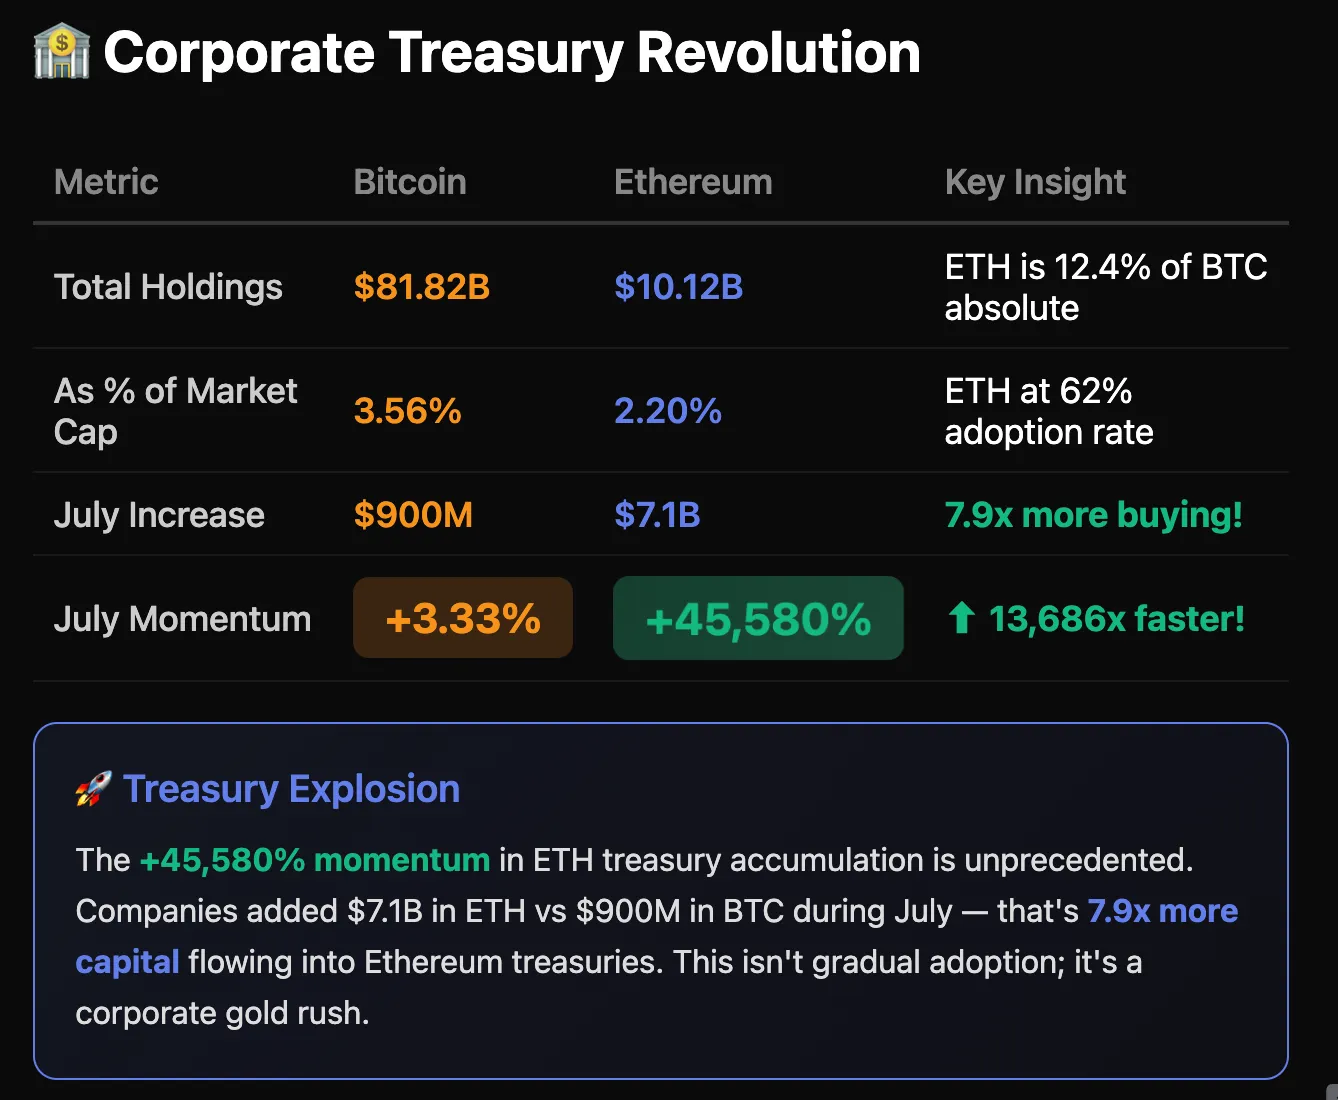
DATs Are Buying ETH At Record Pace
Can the rally sustain? Drivers and risks
Drivers.
- The flow setup remains constructive — and price still lags what similar flows did to BTC. Since Bitcoin’s spot ETFs launched on January 11, 2024, BTC has more than doubled (2x+). By contrast, since Ethereum’s spot ETFs launched on July 23, 2024, ETH is up less than 10%, even though its best month (July) delivered a +50% gain. This disconnect suggests room to run if inflows persist. July’s combined ETF + corporate demand (≈ $11B, > 2% of supply) effectively moved supply from short-term crypto-native holders to stickier TradFi balance sheets, shrinking the liquid float. With more coins parked in ETFs and treasuries, incremental demand should have a larger price impact; the July supply shock is likely to keep working through price in the months ahead.
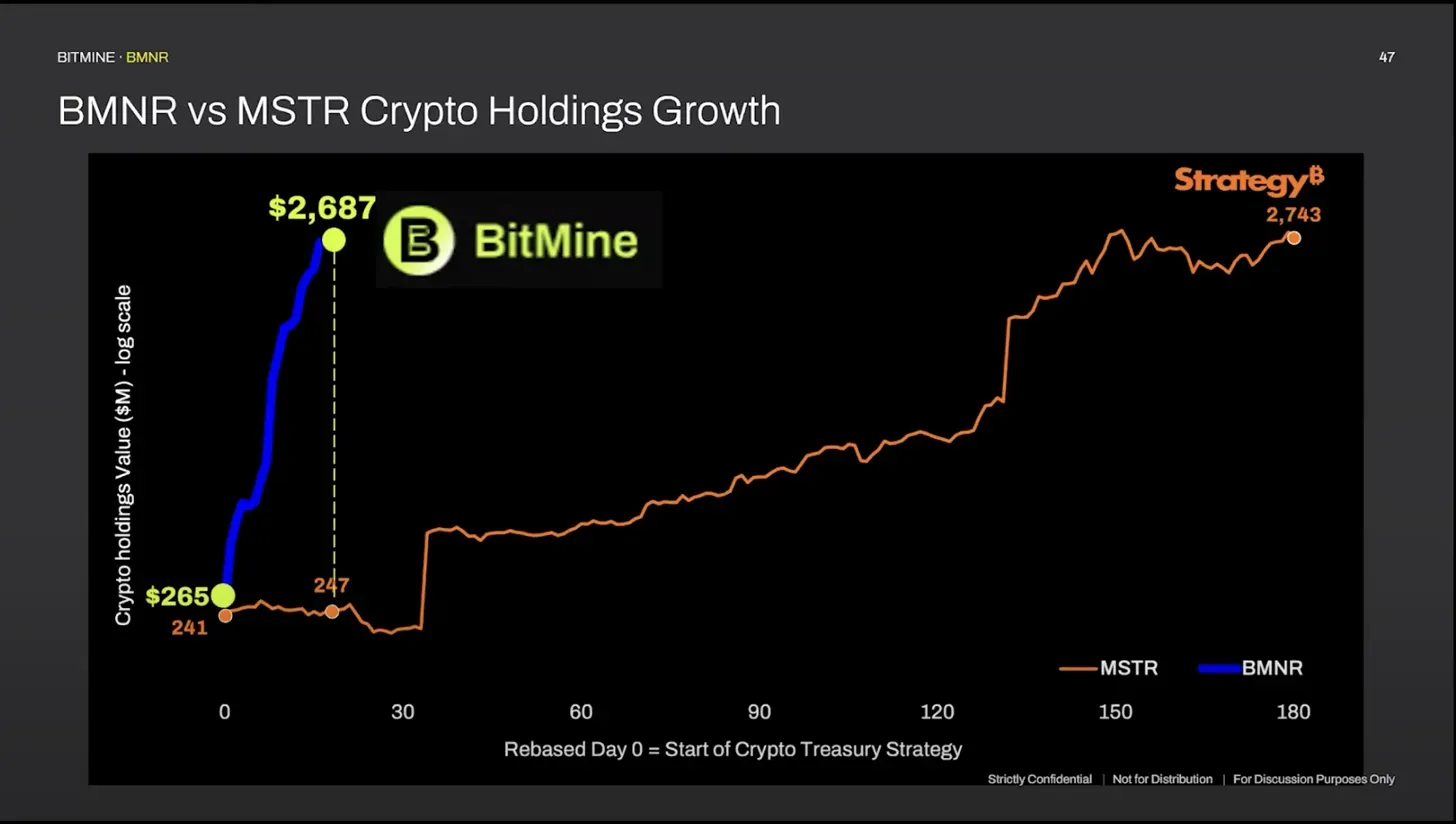
- Corporate Treasury stocks like $SBET and $BMNR still have room to scale – if they migrate from pure ATM equity to convertible debt —the same evolution that turbocharged early BTC treasury strategies.
- ETH’s narrative might resonate more with TradFi than BTC. Ethereum can be framed as a productive asset: it pays a native staking yield, and its fee-burn mechanism reduces net issuance as on-chain activity rises. The network also powers real economic use—stablecoin settlement, DeFi, Layer 2s, and a growing set of tokenization/RWA applications like on-chain stocks. For traditional investors, that mix of cash flow-like characteristics and utility-driven demand (transactions that require ETH for gas) is easier to underwrite than a purely non-yielding, monetary asset. In practice, ETH can be analyzed more like a toll road or payments network—where increasing throughput and usage support value—while BTC remains closer to digital gold. This gives ETH a clearer fundamental story for TradFi frameworks focused on yield, operating leverage, and usage-based valuation.
Risks.
- Treasury-stock fragility — If mNAV premiums compress whenPIPE unlocks are hit, ATM capacity can shrink quickly, reducing marginal demand and increasing volatility in the wrappers.
- ETF flow fatigue — If the multi-week streaks give way to flat or negative prints, price momentum can stall and slide back into range.
Macro and technicals — ETH is still a high-beta, liquidity-sensitive asset. The $4,000 zone is a multi-year resistance zone; failed breakouts can produce sharp retracements.
The post The Ethereum Paradox: High Demand, Stagnant Price appeared first on BitMEX Blog.
BitMEX Blog