The Anchor and the Ceiling: Understanding the Structure of Funding Rates
TL;DR:
Crypto funding rate markets are evolving with the explosive growth of decentralised derivatives platforms like Hyperliquid and the entry of funding rate trading from Pendle. In particular, two structural forces can be attributed to the funding rate market dynamic, creating predictable trading opportunities:
- The Formula’s Anchor (The Floor): The perpetual swap formula has a built-in interest component, forcing rates to cluster around 0.01% (positive bias). Data shows funding rates were positive over 92% of Q3 2025.
- Trader Action: Don’t bet on sustained negative rates. The formula is actively working to push them positively.
- Arbitrage Capital (The Ceiling): Billions of dollars in institutional capital, including players like Ethena, instantly short high-premium contracts when rates spike.
- Trader Action: Don’t expect high rates to last. Spikes are short-lived as arbitrage quickly forces the premium and rate back to the 0.01% baseline.
BitMEX exhibited the most stable funding rates compared to Binance and Hyperliquid, hitting the 0.01% anchor more often than others. For volatility, ETH was the “higher beta” play compared to BTC.
Master the market’s structure—not sentiment—to succeed in funding rate trading.
Introduction
Nine years ago, BitMEX invented the perpetual swap, which fundamentally changed how people trade cryptocurrencies. In our previous Q2 Derivatives Report, “The Evolution of Funding Rates: 9 Years of BitMEX’s XBTUSD Funding Rate Analysis,” we detailed its journey from a volatile, speculative instrument to becoming a mature, stable market. Now, we are witnessing the next stage of that evolution: the emergence of a dedicated funding rate trading market.
Funding rate trading allows traders to move speculating on price and trade the underlying mechanics of the market itself. But what drives these mechanics? In this report, we take a deep dive into the dynamics of the perpetual swap market and the funding rate formula to uncover crucial insights for crypto traders.
Our findings point to two powerful factors influencing the funding rate: the gravitational pull of the 0.01%/8-hour funding rate formula anchor and the sheer weight of institutional arbitrage capital that enforces it. This report will explore these findings, backed by data from Q3 2025, and outline key takeaways for traders based on this structural understanding.
Funding Rates’ Nine-Year Evolution in Review
As we explored in our previous report, the crypto funding rate market for major tokens like Bitcoin has reached maturity. In the early days of perpetual swaps, Bitcoin funding rates frequently exceeded 0.2%/8-hour during bull markets, translating to an annualised rate of over 200%.
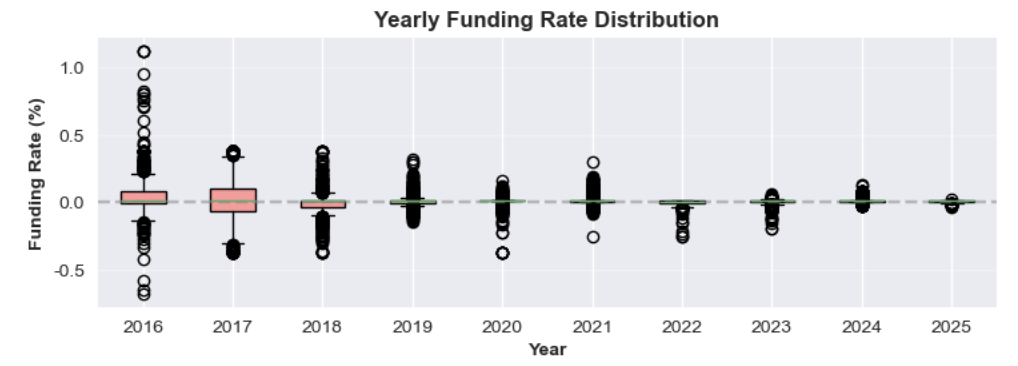
Over the years as the market deepened and more institutional capital flowed in, this volatility subsided. The 2024-2025 cycle established a new normal: the average funding rate now consistently hovers around a baseline of 0.01%/8-hour. This occurs when the perpetual contract’s premium is minimal, causing the rate to default to its interest rate component—a sign of a systematically efficient financial market.
Unpacking the Funding Rate Structure
Why has the funding rate market changed so drastically? This phenomenon can be explained by two key factors:
- The funding rate formula dictates that when perpetual contract prices do not deviate much from the spot price, the rates default to the base interest rate of 0.01%/8-hour.
- A significant amount of capital is being used for basis trading to capture high funding rates.
Let’s explore these concepts in more detail.
Factor 1: The Formula’s Anchor (The Secret Positive Bias)
Funding rates for perpetual contracts are designed to keep the contract’s price aligned with the underlying asset’s spot price. On BitMEX and some other venues, they are calculated every eight hours using a formula that combines two main components: the Premium Index and the Interest Rate, which are balanced by a clamping mechanism.
The general formula for funding rates across exchanges like BitMEX, Binance, and Hyperliquid is:
F = P + Clamp(I−P,−0.05%,0.05%)
Below is a breakdown of each part of the formula.
- Funding Rate (F): Periodic payments exchanged between long and short position holders of a perpetual swap contract.
- Average Premium Index (P): Measures the market sentiment by tracking the difference between the perpetual contract price and the spot price. Calculated as an average over the funding period.
- If P is positive, the contract is trading at a premium (higher than the spot price). Long positions pay short positions.
- If P is negative, the contract is trading at a discount (lower than the spot price).Short positions pay long positions.
- Interest Rate (I): A fixed rate, usually set at 0.01% for an 8-hour period (or 10.95% annually). 0.01%/ was an arbitrary number first used by BitMEX in order to incentivise arbitrage traders to provide liquidity.
- The Clamp Function
Clamp(x, min, max): A buffer mechanism to ensure that the difference between the Interest Rate and the Premium Index (I−P) doesn’t become too extreme. The difference is capped at a maximum of +0.05% and a minimum of -0.05% which prevents the funding rate from swinging too wildly.
Scenario 1: Slight Premium/Discount, Funding Rate = 0.01% / 8-hour
A key feature of the formula is its ability to stabilise the funding rate at the baseline Interest Rate (0.01%) when the market is relatively calm.
The Golden Rule: The funding rate (F) will be exactly 0.01% as long as the Average Premium Index (P) stays within the range of -0.04% to +0.06%.
Inside this range, the Clamp Function perfectly cancels out the premium or discount, defaulting the funding rate back to the Interest Rate.
Example A: Slight Premium
Let’s assume the Average Premium Index (P) is +0.02%.
- Calculate the difference: I−P=0.01%−0.02%=−0.01%
- Apply the Clamp Function: Since -0.01% is within the [-0.05%, +0.05%] range, the clamped value is -0.01%.
- Calculate the final rate: F=P+(clamped value)=0.02%+(−0.01%)=0.01%
Example B: Slight Discount
Now, let’s assume the Average Premium Index (P) is -0.03%.
- Calculate the difference: I−P=0.01%−(−0.03%)=0.04%
- Apply the Clamp Function: Since 0.04% is within the [-0.05%, +0.05%] range, the clamped value is 0.04%.
- Calculate the final rate: F=P+(clamped value)=−0.03%+0.04%=0.01%
Both examples show that regardless of whether the Average Premium Index (P) sits slightly above or below the funding rate, the final rate always sits at 0.01%.
Scenario 2: The Positive Bias (Funding is Positive During a Discount)
A crucial design aspect of many perpetual contracts is their inherent positive bias. This means long positions often still pay short positions a small amount, even when the contract is trading at a slight discount. This happens because the fixed positive Interest Rate (I=0.01%) acts as a floor.
This explains why the funding rate is often a small positive number (e.g., 0.005%) instead of a negative one.
Example: Discount on Perpetuals with Positive Funding Rate
Let’s assume the market is bearish and the Average Premium Index (P) drops to -0.045%.
- Calculate the difference: I−P=0.01%−(−0.045%)=0.055%
- Apply the Clamp Function: The difference, 0.055%, is outside of the clamp’s upper limit. Therefore, the clamp forces the value down to its maximum of 0.05%
- Calculate the final rate: F=P+(clamped value)=−0.045%+0.05%=0.005%
In this example, the funding rate is still positive despite the perpetual contract trading below the spot price. Longs are still paying shorts, demonstrating the structural bias that favours short positions with positive bias.
Scenario 3: When Funding Rates Turn Zero or Negative
For the funding rate to become neutral or negative, the market discount must be significant enough to overcome the positive bias from the Interest Rate.
- Funding becomes 0.00% when the Premium Index (P) is exactly -0.05%.
- I−P=0.01%−(−0.05%)=0.06%
- The clamp caps this at 0.05%
- F=P+(clamped value)=−0.05%+0.05%=0.00%
- Funding becomes negative when the Average Premium Index (P) drops below -0.05%. For instance, if P=−0.10%, the funding rate will turn negative, and shorts will start paying longs to incentivise buying and push the contract price back toward the spot price.
Factor 2: An Ocean of Funding Rate Arbitrage Capital
While the funding rate formula defines the rules, arbitrage capital enforces them. The current open interest for major tokens (Bitcoin, Ethereum, Solana) stands in the tens of billions across top crypto exchanges. Arbitrage players, from proprietary trading firms to DeFi protocols like Ethena, have billions in capital ready to be deployed the moment funding rates become attractive. When the perpetual price trades at a high premium, these institutions sell the perpetual and buy the spot asset to collect the high funding rate and compress the premium back.
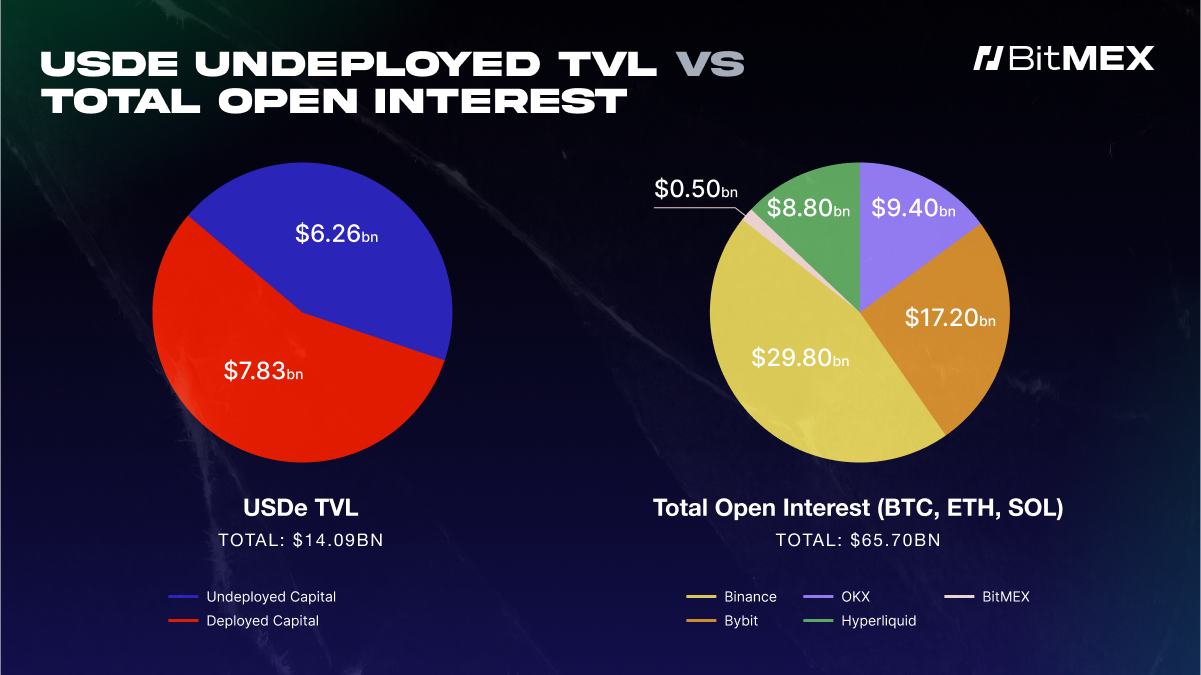
Figure 2: Ethena (USDe) Total Value Locked vs the Total Open Interest for BTC, ETH, and SOL on major crypto exchanges on 25 September 2025
Figure 2 provides colour on how Ethena’s USDe, a major funding rate arbitrage player, plays a significant role in explaining short-lived high funding rates. The pie chart on the left reveals that Ethena (USDe) has $7.83 billion in capital ready to be deployed. The right pie chart shows the total open interest across the top exchanges (on 21 September 2025), which sits at $65.70 billion. When comparing the two charts, it’s clear that a single protocol such as Ethena plays a massive role – its undeployed capital is as much as 12% of the market’s open interest.
Whenever funding rates become attractive, institutions deploy their available capture to capture profit. This arbitrage strategy pushes the high funding rates back down.
In short, the large pool of undeployed capital acts as a ceiling for funding rates – preventing it from staying high for long.
Views in Action: Q3 2025 Funding Rate Recap
To analyse whether the above thesis on funding rates’ floor and ceiling stand true, we analysed funding rate data from Q3 2025 across BitMEX, Binance, and Hyperliquid. This confirmed the two core theories discussed in the previous section:
- Funding rates remain positive the vast majority of the time, driven by the structural positive bias in the calculation formula.
- Funding rates rarely sustain levels far above the 0.01% baseline, as big pools of arbitrage capital from institutions like Ethena step in to compress high premiums.
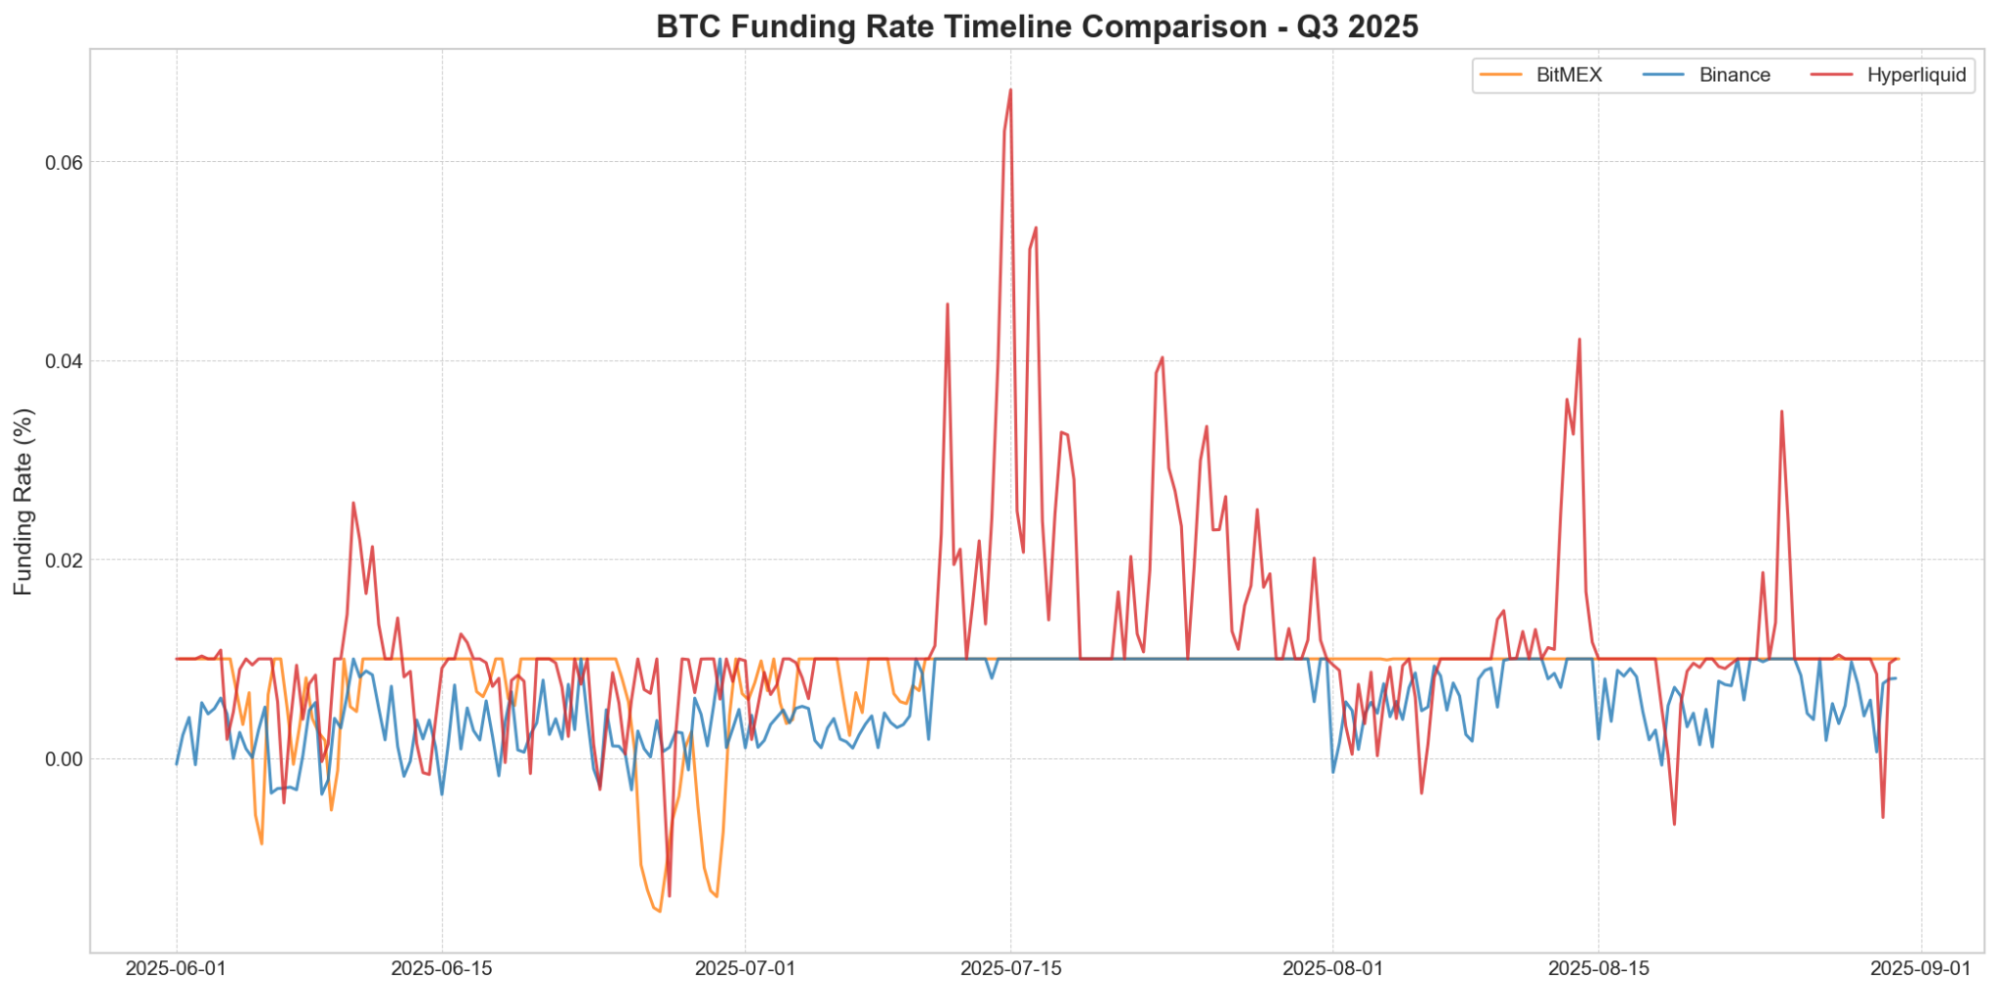
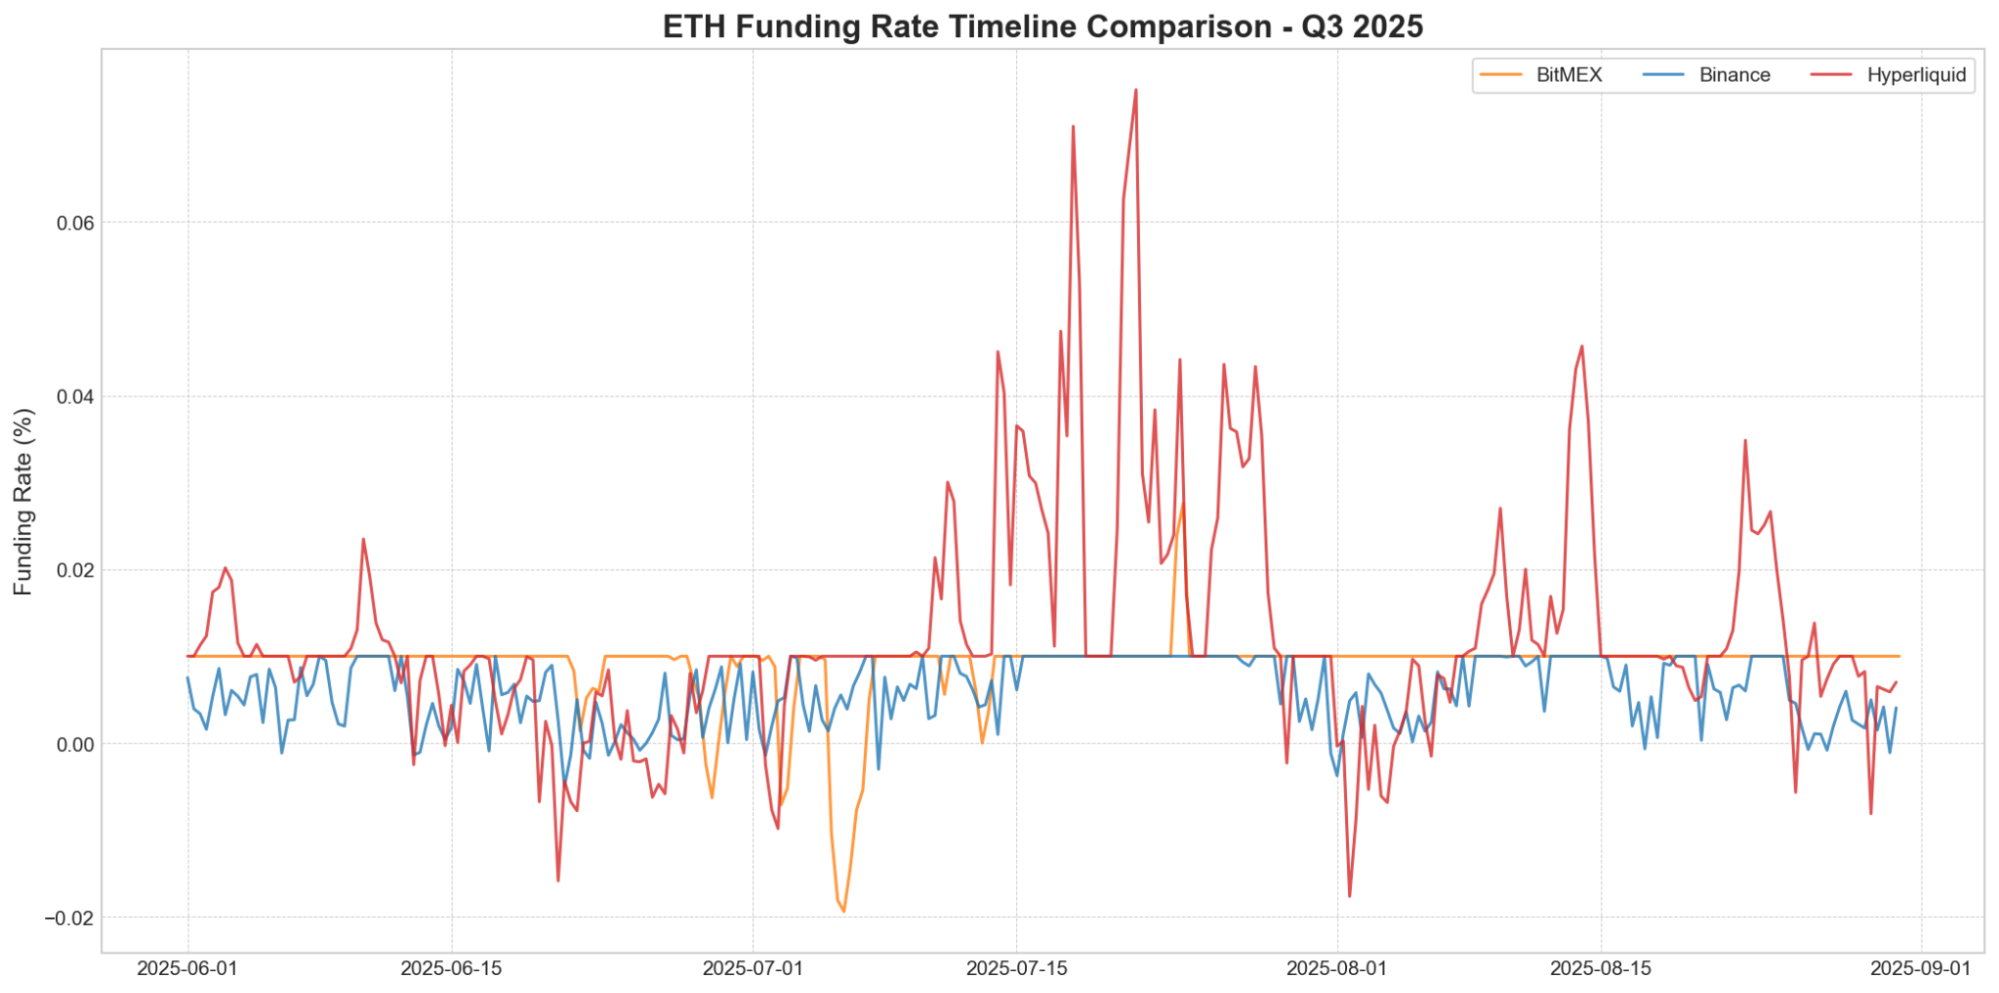
Figure 3 and figure 5 shows the BTC and ETH funding rates history in Q3 2025, which confirms two of our core findings. First, funding rates for all three venues remained positive for the vast majority of the quarter, a direct result of the formula’s structural positive bias. Second, it shows that funding rates on BitMEX and Binance have been tightly anchored around the 0.01% baseline, illustrating the powerful effect of arbitrage capital.
The notable exception is Hyperliquid, whose funding rate exhibits significant volatility and frequent spikes far above this baseline—a phenomenon we will dissect in the next section.
Funding Rate Variation Across Exchanges: Stability vs. Volatility
Analysis of Bitcoin (BTC) Funding Rates on BitMEX, Hyperliquid, and Binance, and Hyperliquid
Exchange | Mean | Std Dev | Min | Max | Freq. of 0.01% | Freq. Positive |
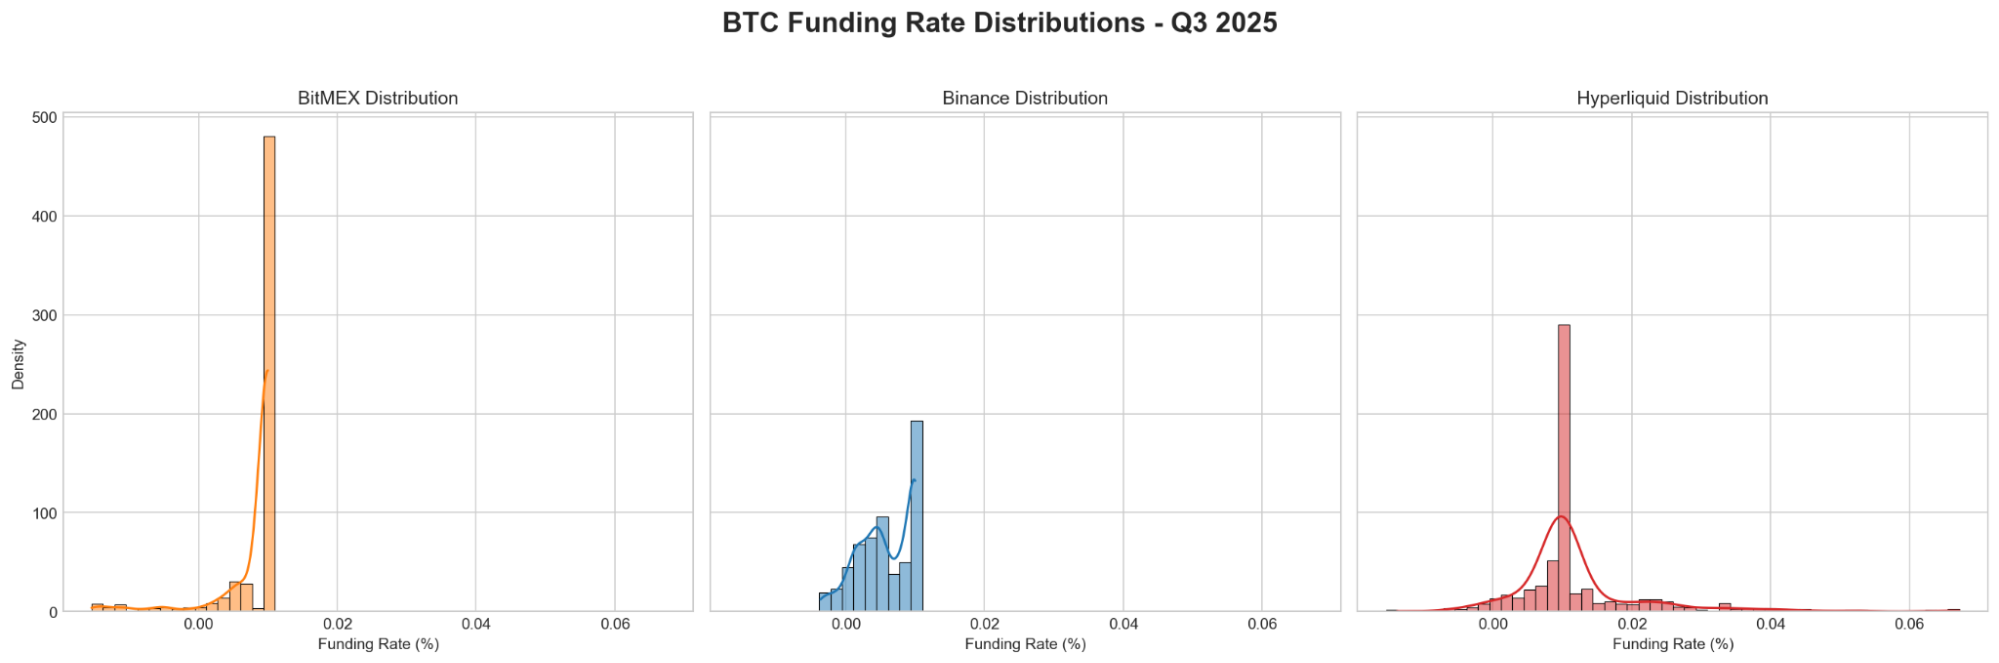
BitMEX | 0.0081% | 0.0049% | -0.0154% | 0.0100% | 78.19% | 93.83% |
Binance | 0.0057% | 0.0039% | -0.0036% | 0.0100% | 30.70% | 92.54% |
Hyperliquid | 0.0120% | 0.0097% | -0.0139% | 0.0672% | 39.45% | 95.98% |
Analysis of Ethereum (ETH) Funding Rates on BitMEX, Hyperliquid, and Binance, and Hyperliquid
Exchange | Mean | Std Dev | Min | Max | Freq. of 0.01% | Freq. Positive |
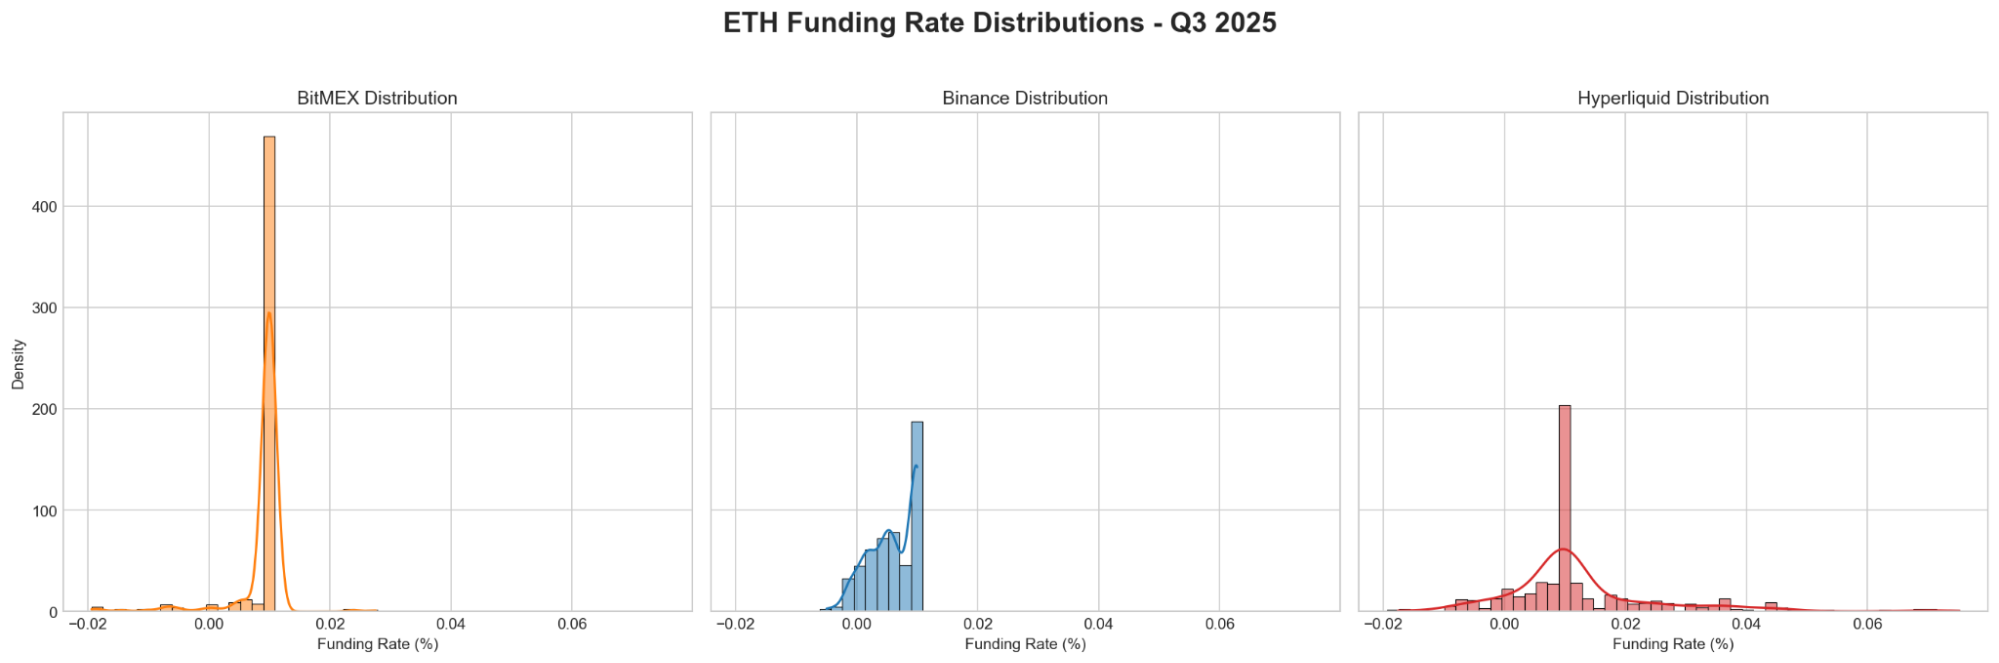
BitMEX | 0.0090% | 0.0045% | -0.0194% | 0.0276% | 87.52% | 95.12% |
Binance | 0.0060% | 0.0038% | -0.0050% | 0.0100% | 31.71% | 92.68% |
Hyperliquid | 0.0126% | 0.0131% | -0.0176% | 0.0752% | 33.57% | 88.81% |
The above charts clearly show discrepancies between funding rate stability when comparing BitMEX with other exchanges like Hyperliquid and Binance.
- BitMEX: As the one the oldest crypto derivative exchanges, BitMEX serves as the baseline. For BTC, the funding rate was exactly 0.01% for 78.19% of the analysis period and 87.52% of the analysis for ETH. The low standard deviation metric indicates that its funding rates are the most predictable. This reflects that the BTC and ETH perpetual contract premium on BitMEX is on par with spot prices most of the time.
- Binance: As the largest crypto exchange, Binance’s funding rates had the lowest average funding rate for both BTC and ETH, with its median rate consistently below 0.01%. This indicates that consistent shorting pressure is present on Binance when compared to BitMEX. It reflects the average market sentiment over a long period, but not the excitement of a single moment.
- Hyperliquid: Demonstrating the most volatile funding rates out of the three venues, Hyperliquid consistently posted the highest mean funding rates and standard deviation. This is a direct result of its 1-hour funding rate calculation window, as well as its inability to offer leverage as high as BitMEX, which makes it hyper-responsive to basis. The maximum observed rates of 0.067% for BTC and 0.075% for ETH are far beyond what other exchanges experienced, highlighting its tendency for sharp, aggressive spikes.
Bitcoin vs. Ethereum Funding Rates
While the funding rates for both assets followed similar overall trends across exchanges, the data reveals a key difference: ETH funding rates were the “higher beta” play during Q3 2025:
- Slightly Higher Rates: On every exchange, ETH’s average funding rate was slightly higher than BTC’s.
- Significantly Higher Volatility: On Hyperliquid, ETH’s funding rate was 0.0131%, nearly 35% higher than BTC’s 0.0097%. This means that not only were ETH funding rates higher on average, but they were also far more volatile and prone to more extreme spikes.
Key Takeaways for Traders
Understanding this market structure provides a framework for identifying high-probability trades. Instead of predicting sentiment, traders can bet on the enforcement of the market’s own rules.
- The Structural Floor: Don’t Fight the Formula’s Positive Bias
A core finding is that funding rates are overwhelmingly positive—our Q3 2025 data shows this is true over 92% of the time. This isn’t random; it’s a direct result of the formula’s +0.01% interest component, which provides a constant tailwind. Even if you are extremely bearish, remember that a positive funding rate below 0.01% already means the perpetual is trading at a discount to spot. For the rate to turn negative, the market must overcome this built-in positive drift.
Therefore, if a marketplace like Boros shows a near-zero implied funding rate, going long is a structurally advantaged position compared to shorting and hoping for a sustained negative rate. In this scenario, the funding rate formula is not your friend—it’s actively working to push the rate back into positive territory.
- The Arbitrage Ceiling: Don’t Expect High Rates to Last
Just as the formula creates a soft floor, the availability of large institutional capital creates a hard ceiling. As soon as funding rates climb sigtnificantly above the 0.01% baseline, they advertise a double-digit annualised yield that is irresistible to arbitrators.
Billions in capital from institutions and DeFi protocols are constantly monitoring for these opportunities. When a premium appears, they simultaneously short the perpetual and buy the spot asset, a trade that rapidly compresses the premium and forces the funding rate back down. This means that while rates can spike, these spikes are inherently unstable and short-lived. Betting on sustained high rates is a bet against a vast, efficient, and well-capitalised segment of the market.
Conclusion
Funding rate trading has newly arrived in the crypto industry, and at BitMEX, we are excited to see the next evolution of crypto derivatives. Our analysis shows that succeeding in the funding rate market comes not from predicting chaotic sentiment, but from mastering the market’s underlying structure.
Two core factors—the funding formula’s gravitational pull to 0.01% and the large pool of arbitrage capital that enforce it—have created a remarkably predictable environment. By understanding why rates are anchored and why negative rates are anomalies, traders can move beyond price speculation and exploit the high-probability opportunities embedded in the very architecture of the market BitMEX pioneered nine years ago.
To be the first to know about our new listings, product launches, giveaways and more, we invite you to join one of our online communities and connect with other traders. For the absolute latest, you can also follow us on Twitter, or read our blog and site announcements.
In the meantime, if you have any questions please contact Support who are available 24/7.
The post The Anchor and the Ceiling: Understanding the Structure of Funding Rates appeared first on BitMEX Blog.
BitMEX Blog