Asset level portfolio performance stats now live on Kraken Pro

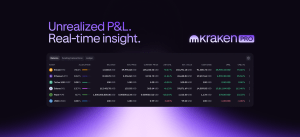
Your trades tell a story. Now you can read it — clearly, in real time.
With new asset level portfolio performance metrics now built into Kraken Pro, you can instantly see how every asset in your portfolio is performing — whether you’re holding long or reacting fast to market moves.
On both web and mobile, you can now view:
 Unrealized P&L
- Cost Basis
- Average Price
 Unrealized P&L
 Cost Basis
 Average Price
See your cost basis, average price, and unrealized P&L across assets
What do these stats mean?
| Metric | What it tells you |
| Average Price | Your true entry — what you paid for each asset, weighted by balance |
| Cost Basis | Your total stake (average price × current balance) |
| Unrealized P&L | Your potential gain/loss if you sold now |
| Unrealized P&L % | How far up or down your position is, in percentage terms |

BTC showing +35.04% Unrealized P&L — a high-conviction trade playing out
Five ways traders are using these stats
- Take profits with precision
Got a rule to trim at +20%? Your Unrealized P&L % tells you exactly when you’ve hit it.
Dogecoin at +67%? Might be time to lock it in. - Reassess underperformers
ETH at -4.6%? This might be the nudge to reevaluate — or double down. - Improve entries over time
See a small loss in a long-term position you still believe in? Add more and lower your average price. - Adjust risk before it’s too late
A slipping P&L can help you catch trend reversals before they get worse. - Track your strategy – no spreadsheet required Use average price vs. current price to review the quality of your entries. Log it, learn, and adapt.

Where to find it
You’ll see these stats live in three places on Kraken Pro Web:
- The Portfolio tab
- The Home page
- The Balances tab (add this to your Trade page layout)
 On mobile, just head to the Portfolio tab and tap any asset to see its performance.

Pro tips for power users
- Track trends — Use Unrealized P&L % to find your strongest plays
- Improve timing — Spot winners early or flag risks before they turn into losses
- Simplify journaling — Use these stats as the base for your trade journal and execution reviews
A quick reminder
 These metrics are for portfolio tracking purposes only — not tax reporting. Your region may have its own rules for calculating cost basis and capital gains.
Ready to see how your portfolio is really performing?
- Open Kraken Pro on web or mobile
- Head to the Portfolio tab or Trade page → Balances
- View your Unrealized P&L, Cost Basis, and Average Price for every asset — and use it to guide your next move!
Whether you’re capturing short-term volatility or building for the long haul, these metrics bring powerful clarity to every trade 
The post Asset level portfolio performance stats now live on Kraken Pro appeared first on Kraken Blog.
Kraken Blog