
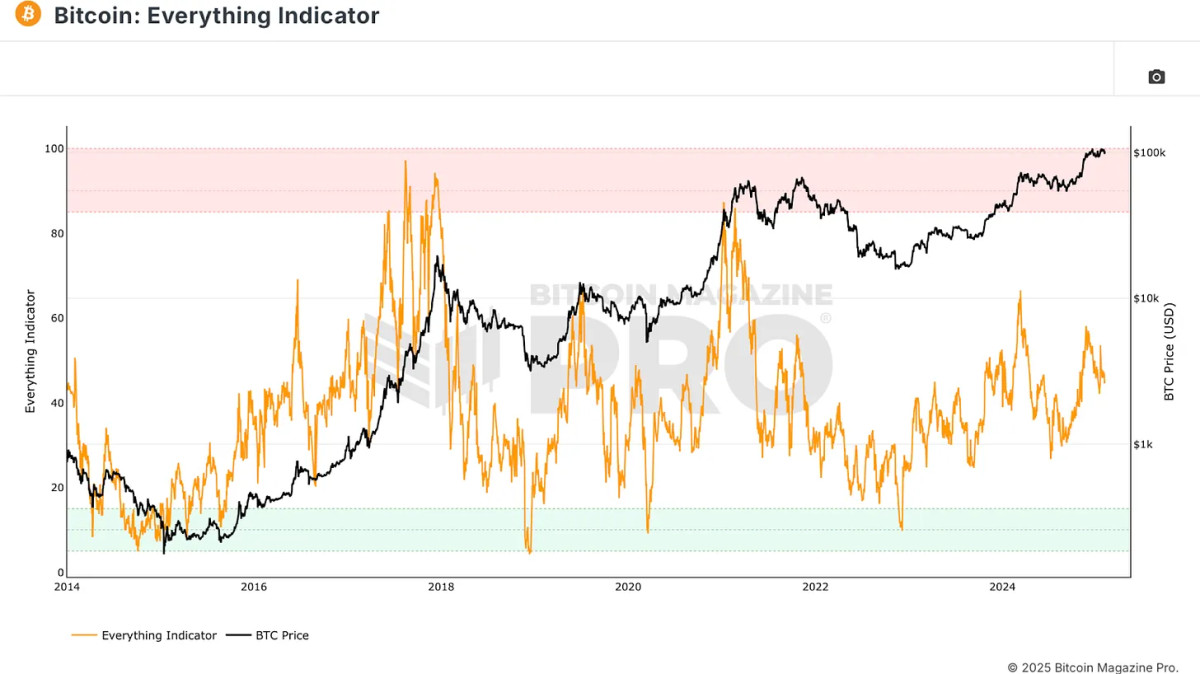
Introducing the Bitcoin Everything Indicator
Wouldn’t it be great if we had one all-encompassing metric to guide our Bitcoin investing decisions? That’s precisely what has been created, the Bitcoin Everything Indicator. Recently added to Bitcoin Magazine Pro, this indicator aims to consolidate multiple metrics into a single framework, making Bitcoin analysis and investment decision-making more streamlined.
For a more in-depth look into this topic, check out a recent YouTube video here: The Official Bitcoin EVERYTHING Indicator
Why We Need a Comprehensive Indicator
Investors and analysts typically rely on various metrics, such as on-chain data, technical analysis, and derivative charts. However, focusing too much on one aspect can lead to an incomplete understanding of Bitcoin’s price movements. The Bitcoin Everything Indicator attempts to solve this by integrating key components into one clear metric.
The Core Components of the Bitcoin Everything Indicator
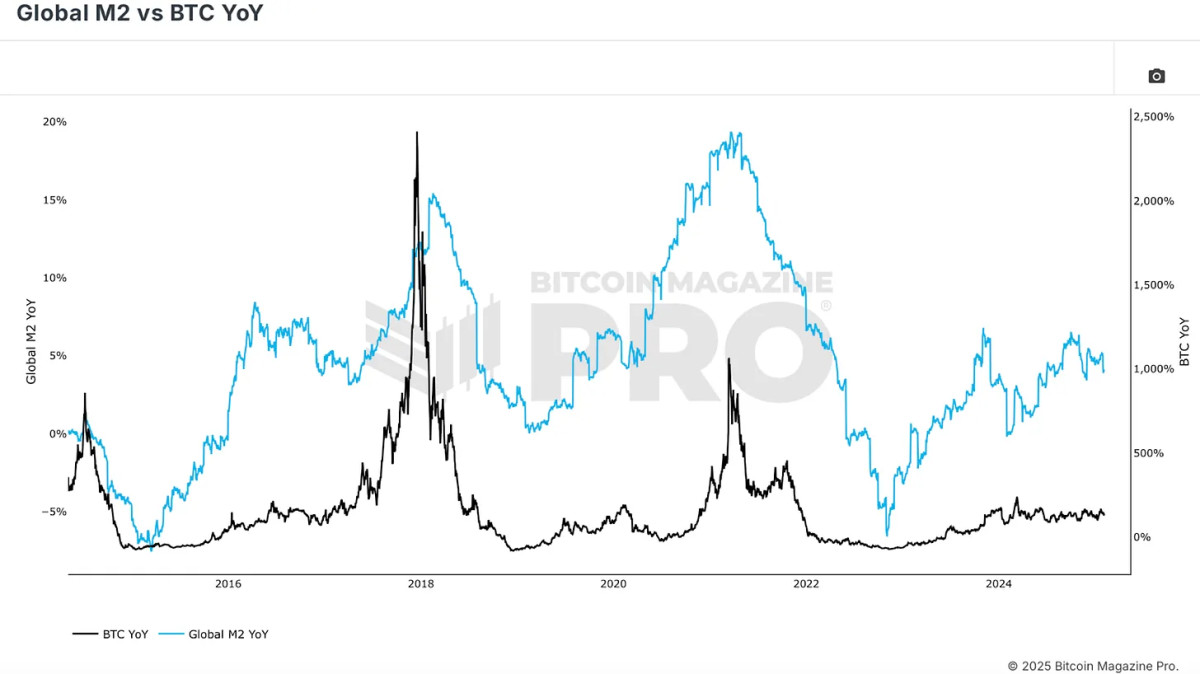
Bitcoin’s price action is deeply influenced by global liquidity cycles, making macroeconomic conditions a fundamental pillar of this indicator. The correlation between Bitcoin and broader financial markets, especially in terms of Global M2 money supply, is clear. When liquidity expands, Bitcoin typically appreciates.
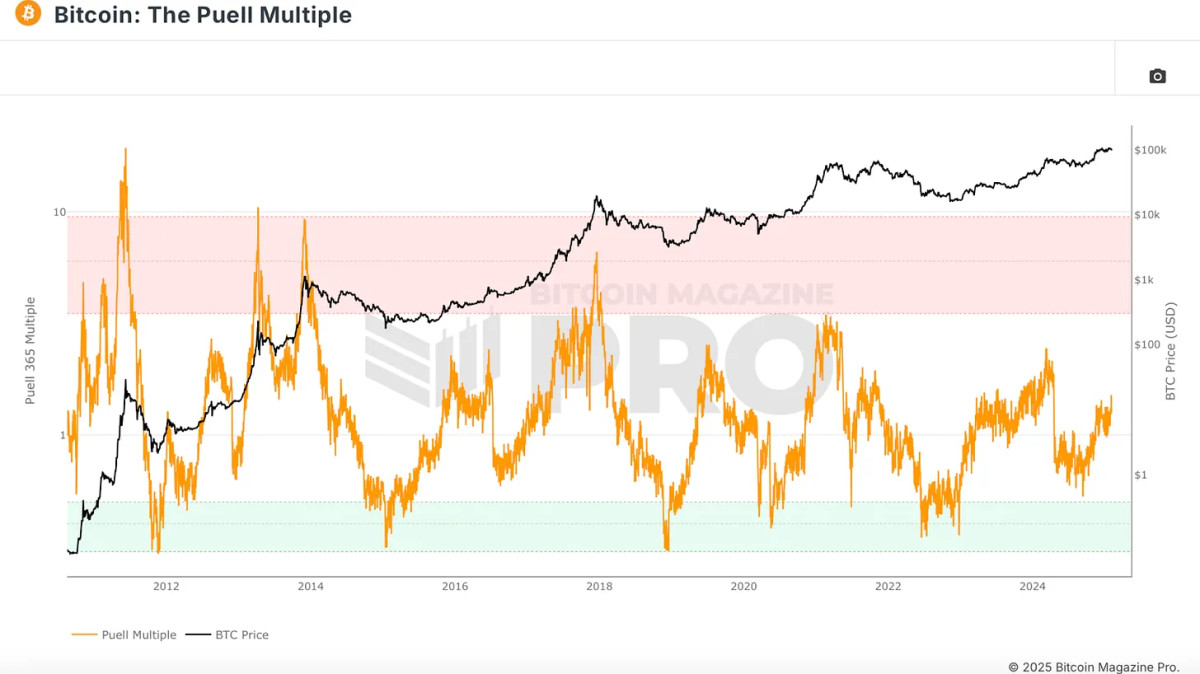
Fundamental factors like Bitcoin’s halving cycles and miner strength play an essential role in its valuation. While halvings decrease new Bitcoin supply, their impact on price appreciation has diminished as over 94% of Bitcoin’s total supply is already in circulation. However, miner profitability remains crucial. The Puell Multiple, which measures miner revenue relative to historical averages, provides insights into market cycles. Historically, when miner profitability is strong, Bitcoin tends to be in a favorable position.
On-chain indicators help assess Bitcoin’s supply and demand dynamics. The MVRV Z-Score, for example, compares Bitcoin’s market cap to its realized cap (average purchase price of all coins). This metric identifies accumulation and distribution zones, highlighting when Bitcoin is overvalued or undervalued.

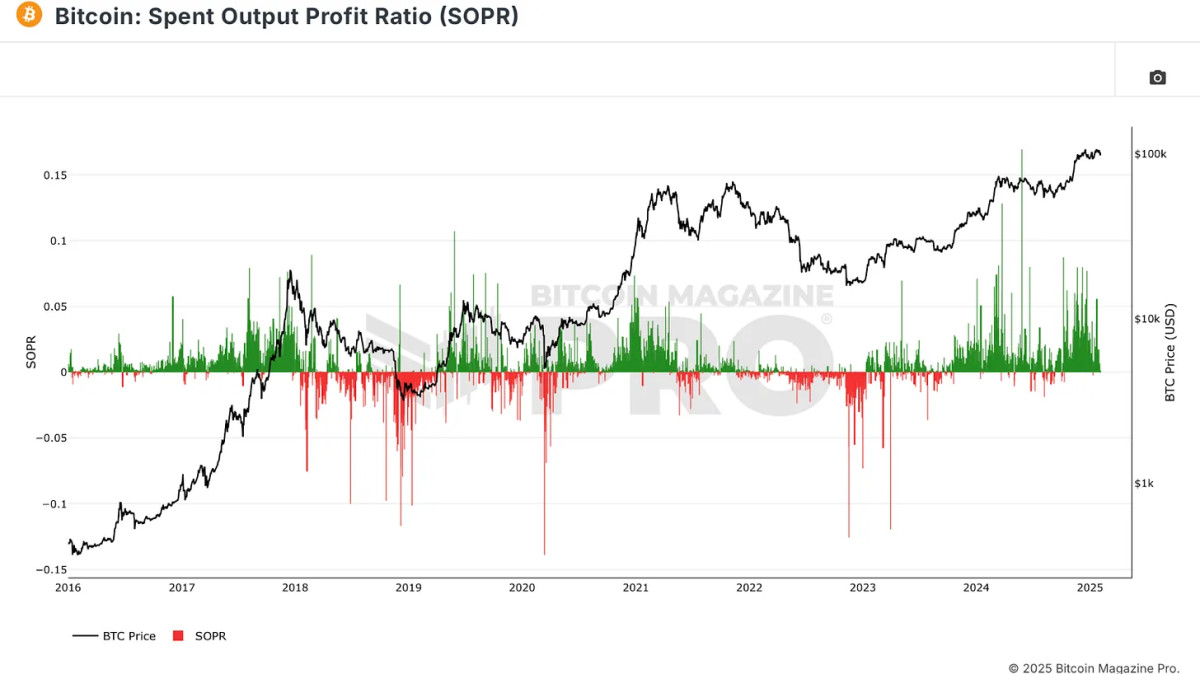
Another critical on-chain metric is the Spent Output Profit Ratio (SOPR), which examines the profitability of coins being spent. When Bitcoin holders realize massive profits, it often signals a market peak, whereas high losses indicate a market bottom.
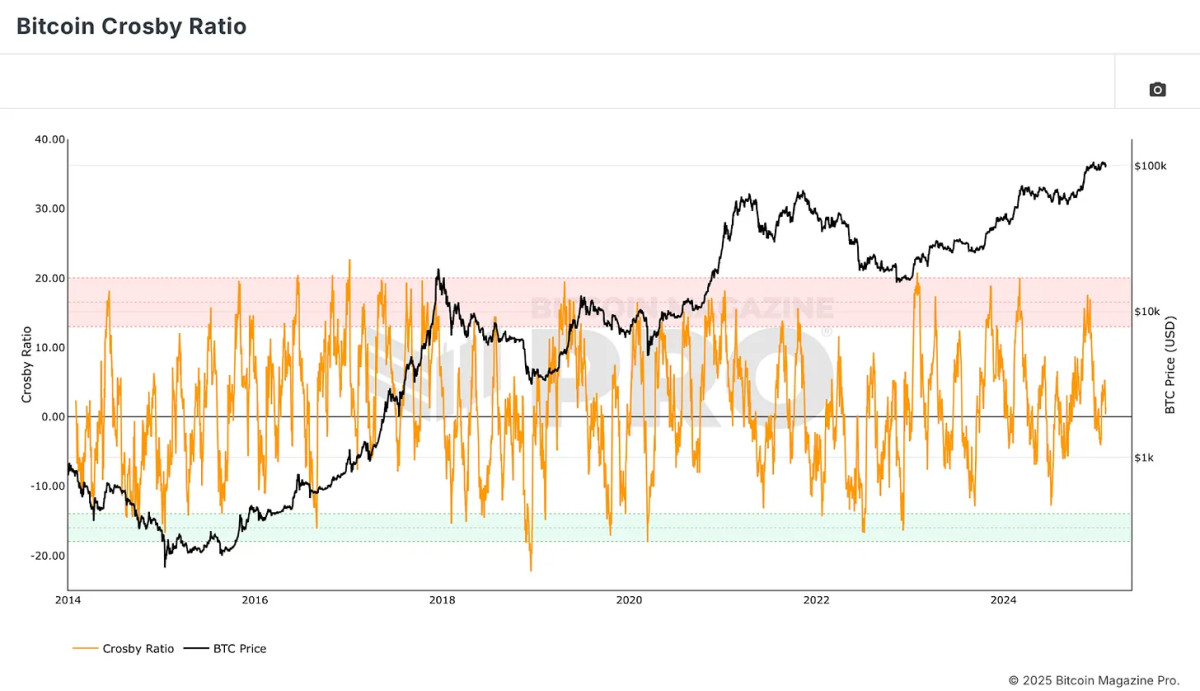
The Bitcoin Crosby Ratio is a technical metric that assesses Bitcoin’s overextended or discounted conditions purely based on price action. This ensures that market sentiment and momentum are also accounted for in the Bitcoin Everything Indicator.
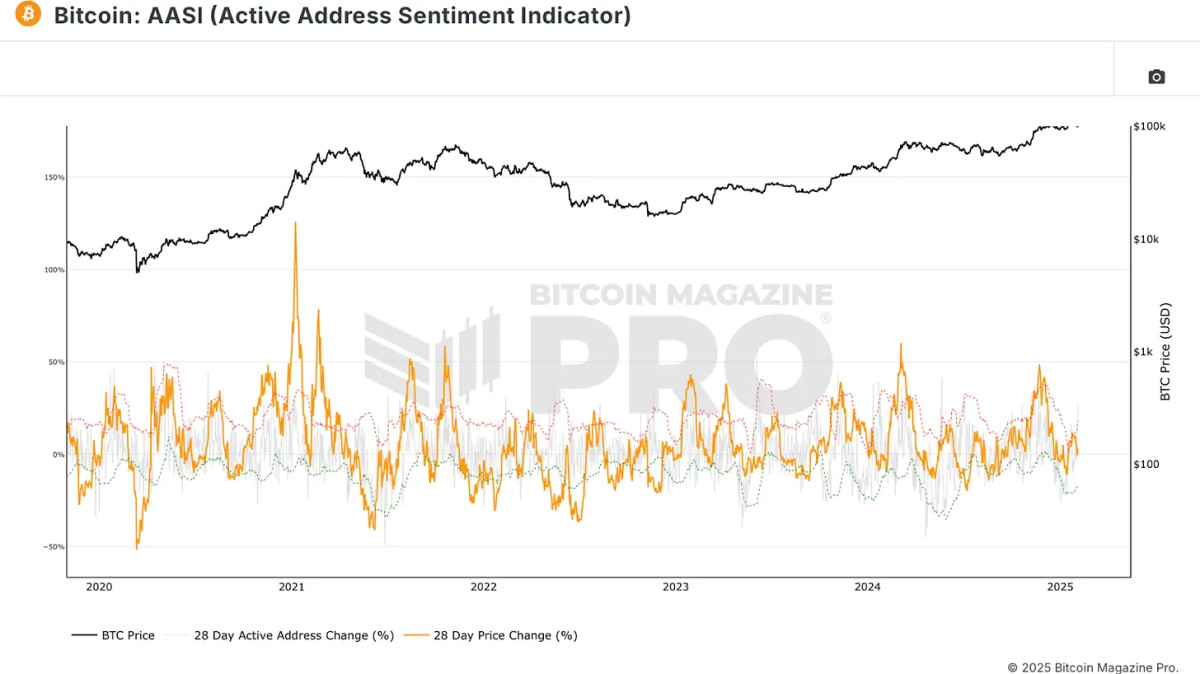
Network usage can offer vital clues about Bitcoin’s strength. The Active Address Sentiment Indicator measures the percentage change in active addresses over 28 days. A rise in active addresses generally confirms a bullish trend, while stagnation or decline may signal price weakness.
How the Bitcoin Everything Indicator Works
By blending these various metrics, the Bitcoin Everything Indicator ensures that no single factor is given undue weight. Unlike models that rely too heavily on specific signals, such as the MVRV Z-Score or the Pi Cycle Top, this indicator distributes influence equally across multiple categories. This prevents overfitting and allows the model to adapt to changing market conditions.

Historical Performance vs. Buy-and-Hold Strategy
One of the most striking findings is that the Bitcoin Everything Indicator has outperformed a simple buy-and-hold strategy since Bitcoin was valued at under $6. Using a strategy of accumulating Bitcoin during oversold conditions and gradually selling in overbought zones, investors using this model would have significantly increased their portfolio’s performance with lower drawdowns.
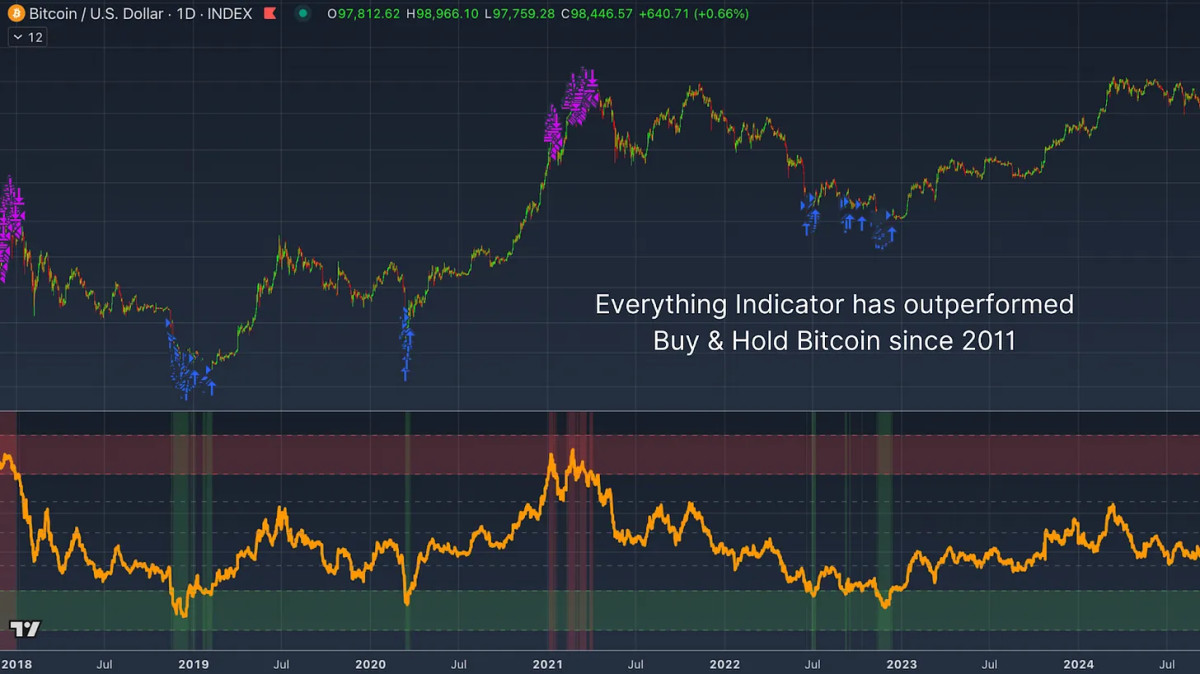
For instance, this model maintains a 20% drawdown compared to the 60-90% declines typically seen in Bitcoin’s history. This suggests that a well-balanced, data-driven approach can help investors make more informed decisions with reduced downside risk.
Conclusion
The Bitcoin Everything Indicator simplifies investing by merging the most critical aspects influencing Bitcoin’s price action into a single metric. It has historically outperformed buy-and-hold strategies while mitigating risk, making it a valuable tool for both retail and institutional investors.
For more detailed Bitcoin analysis and to access advanced features like live charts, personalized indicator alerts, and in-depth industry reports, check out Bitcoin Magazine Pro.
Disclaimer: This article is for informational purposes only and should not be considered financial advice. Always do your own research before making any investment decisions.
Bitcoin Magazine – Bitcoin News, Articles and Expert Insights