Bitcoin vs gold shows potential bottom signals as BTC bulls defend $70K

Bitcoin (BTC) has endured a 14-month bear market against gold, with the BTC/gold ratio and momentum indicators at historic lows that previously marked cycle bottoms.
Key takeaways:
The BTC/GOLD ratio is at historic lows as multiple indicators hint at a cycle bottom.
Bitcoin price must hold $70,000 to avoid a deeper drop over the coming weeks.
BTC/GOLD RSI, MACD print classic reversal signal
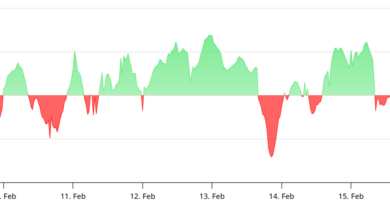
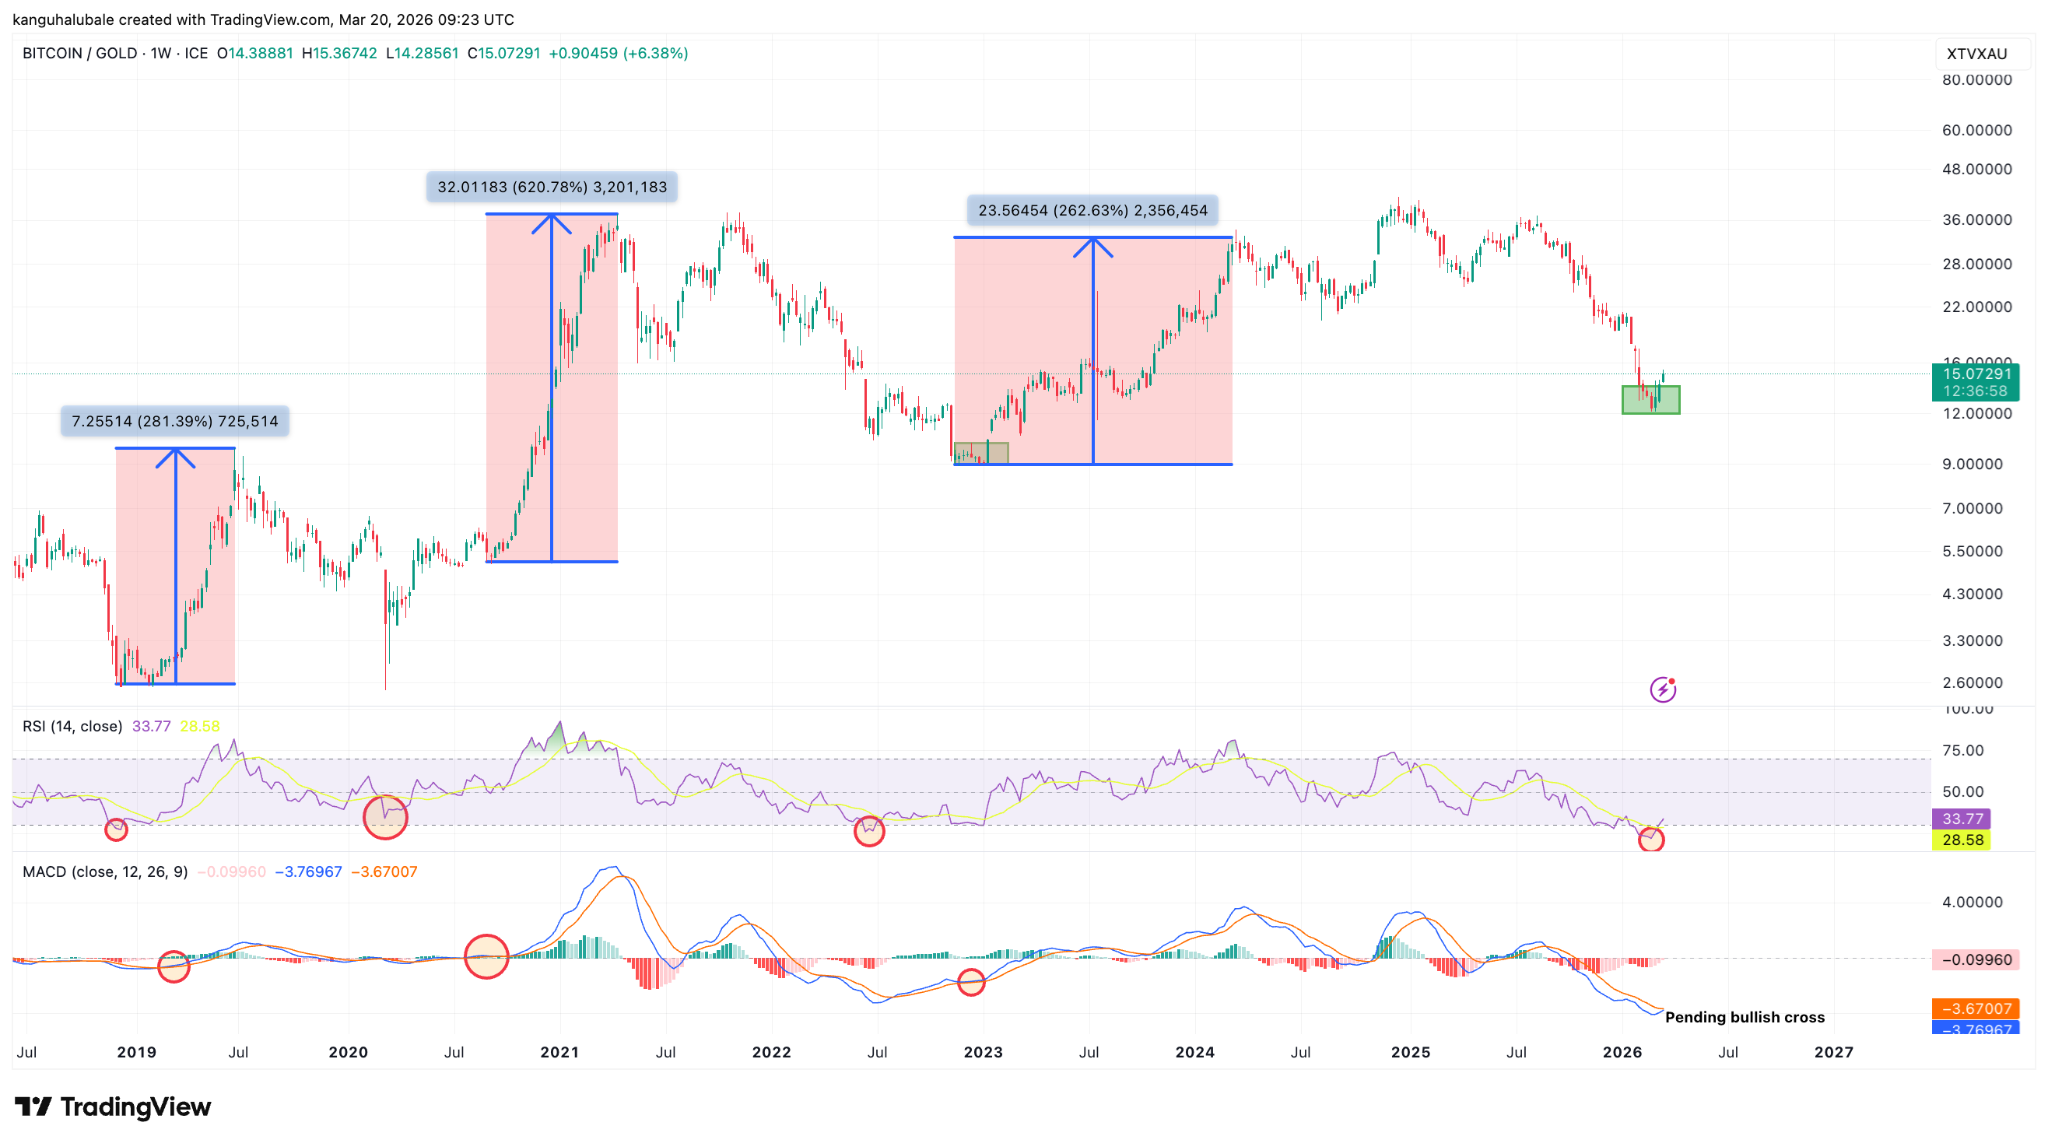
Data from TradingView reveals that the relative strength index (RSI) of the BTC/GOLD ratio has begun climbing.
The weekly RSI reached its most oversold level of 21 in mid-February, signaling fading bearish momentum.
Related: Bitcoin tests old 2021 top as gold falls to six-week lows under $4.7K
Similarly, the moving average convergence divergence (MACD) indicator has dropped to its lowest level ever and is about to produce a bullish cross.
Note that previous bullish crosses, particularly coming after the RSI has recovered from oversold conditions, have marked macro bottoms for the ratio.
This ultimately led to 280%-620% Bitcoin price breakout against gold, as seen in 2019, 2021, and 2023.

The RSI has now recovered to 33 from 21 in mid-February. When combined with a buy signal on the MACD, the picture begins to resemble previous cycles.
“Bottom is in for $BTC vs Gold,” technical analyst James Easto said in an X post on Friday, adding that the “stage is set” for Bitcoin’s recovery.
The last time Bitcoin bottomed against gold was in November 2022. It marked the beginning of a 700% BTC price rally to its current all-time high of $126,000.
Analysts at GeoMetric said the past 3 BTC/GOLD bear markets have taken between 12-14 months, with the drawdowns ranging from 75% to 84%.
About 13 months have elapsed in the current cycle, which has “so far gone down 81%, surpassing the 2021 bear market,” the analysts said, adding:
“I think there is a solid case for a potential bottom here.”

Investor and analyst Crypto Fergani echoed both scenarios discussed above saying:
“For over 13 years, we’ve seen the same pattern: Bitcoin enters a bear market against gold that lasts roughly 400 days. During that time, the RSI falls into deeply oversold territory. Historically, these phases have always marked the bottom.”
Bitcoin price must hold above $70,000
Meanwhile, BTC/USD remains cautiously bullish as long as it holds the $68,000-$70,000 support zone. This is where the 200-week exponential moving average (EMA) and 50-day simple moving average sit.
The 200-week EMA forms a key support band for BTC price during bear markets, and analysts warn that its reliability could be tested on Sunday’s weekly close.
Bitcoin analyst AlphaBTC said he had faith that Bitcoin will recover to $80,000 before dropping toward $50,000, as long as the price stayed above the weekly low at $68,800.
“I don’t want to see this week’s low lost, otherwise it’s going to break back down to range lows or lower!”

As Cointelegraph reported, holding $70,000 would align with a previous fractal recovery path, opening a move toward $76,000-$80,000.
This article does not contain investment advice or recommendations. Every investment and trading move involves risk, and readers should conduct their own research when making a decision. While we strive to provide accurate and timely information, Cointelegraph does not guarantee the accuracy, completeness, or reliability of any information in this article. This article may contain forward-looking statements that are subject to risks and uncertainties. Cointelegraph will not be liable for any loss or damage arising from your reliance on this information.