Why is Bitcoin price stuck?

The price of Bitcoin (BTC) has remained fairly stable for several days in a row. With BTC price volatility subsiding, cryptocurrency markets are digesting the SEC’s lawsuits against Binance and Coinbase.
So why is Bitcoin’s price stuck and what will be the next catalyst for a big move? Let’s take a closer look.
Why is Bitcoin price stuck?
BTC price dropped 1.5% week-to-date to around $26,690 despite several knee-jerk price moves in reaction to the U.S. Securities and Exchange Commission’s (SEC) lawsuits against Binance and Coinbase.

Related: Breaking: Binance.US suspends USD deposits, warns of fiat withdrawal pause
The EMA range
In recent months, certain technical barriers have played a key role in subduing both bulls and bears.
For instance, a strong accumulation sentiment is visible near Bitcoin’s 200-day exponential moving average (20-day EMA; the blue wave) at around $25,270. This helped contain the selloff that ensued from the SEC lawsuits earlier this week.

On the other hand, the 50-day EMA (the red wave) near $27,220 has served as a profit-taking indicator, thus leaving the Bitcoin price inside the purpled $25,000-27,220 consolidation range despite occasional breakout attempts.
Bitcoin bears are cautious ahead of Fed meet
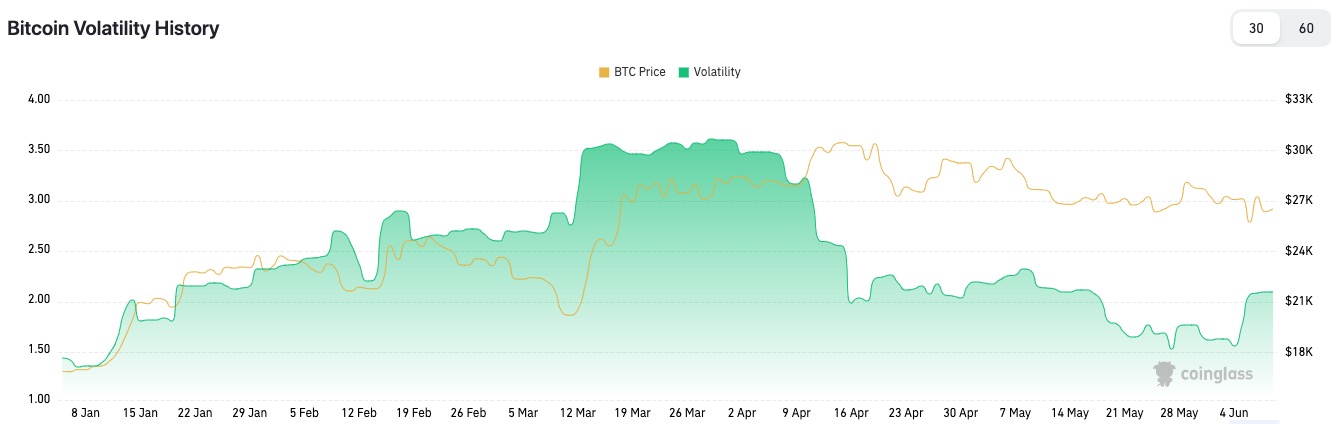
Interestingly, Bitcoin 30-day volatility around the SEC lawsuits is roughly half of what was during the banking crisis rally in March 2023.

This suggests a cautious approach by bears, primarily ahead of the Federal Reserve’s potential rate hike pause decision on June 16 — a potentially bullish event for Bitcoin. In the meantime, BTC price may continue consolidating inside the $26,000-27,450 range.
Related: Bitcoin price can gain 60% if ‘textbook’ chart pattern confirms — Trader
Will BTC price rise further in 2023?
Bitcoin’s long-term bias tilts bullish as long as it holds its 200-week EMA (the blue wave in the chart below) as support. Its bull flag scenario also indicates a potential breakout toward $35,000 in 2023.

Conversely, a decisive breakdown below the flag and the 200-week EMA will have Bitcoin bears calling for a drop to the key $20,000 support level.
This article does not contain investment advice or recommendations. Every investment and trading move involves risk, and readers should conduct their own research when making a decision.


