There’s a simple formula for adding crypto to your portfolio

Imagine coming home and opening your fridge to find a jar filled with your favorite juice. After taking a sip, you realize that the kind soul who prepared the juice added too much water, and there’s not much you can do to fix it — removing water from juice is a complicated process. However, if instead the juice-maker was too stingy with water, you can simply dilute the juice with extra water and enjoy a perfect refreshing drink.
A similar phenomenon happens with the risk of financial assets. If an asset has too little risk, it is complicated to “remove water” and make it riskier, usually through leverage. On the contrary, if the asset is too risky, it is straightforward to dilute it with cash equivalents, such as short-term Treasury Bills, or T-Bills.
Crypto assets have emerged as a new asset class in the past 14 years. As they’ve gained popularity, debates have arisen about their role in a portfolio of traditional assets. The controversy largely stems from concerns about the level of risk associated with these assets, which is significantly higher than that of even the riskiest traditional assets.
Related: What Paul Krugman gets wrong about crypto
Well, instead of complaining about the high risk, one can add some water (e.g., T-Bills) and then check how well the diluted crypto assets fit in a traditional assets portfolio. This is precisely what we did. We took three years of post-pandemic data, from second quarter 2020 until first quarter 2023, for indices representing (global) equities (the MSCI World Index), (global) bonds (the Bloomberg Global Agg Credit Total Return Index Value Hedged USD), short-term T-Bills (the Bloomberg 1-3 Month U.S. Treasury Bill Index), and crypto. The next step was to dilute crypto with T-Bills. We chose two parts crypto for three parts T-Bills, which led to volatility levels that were less than double what is typical for equities.
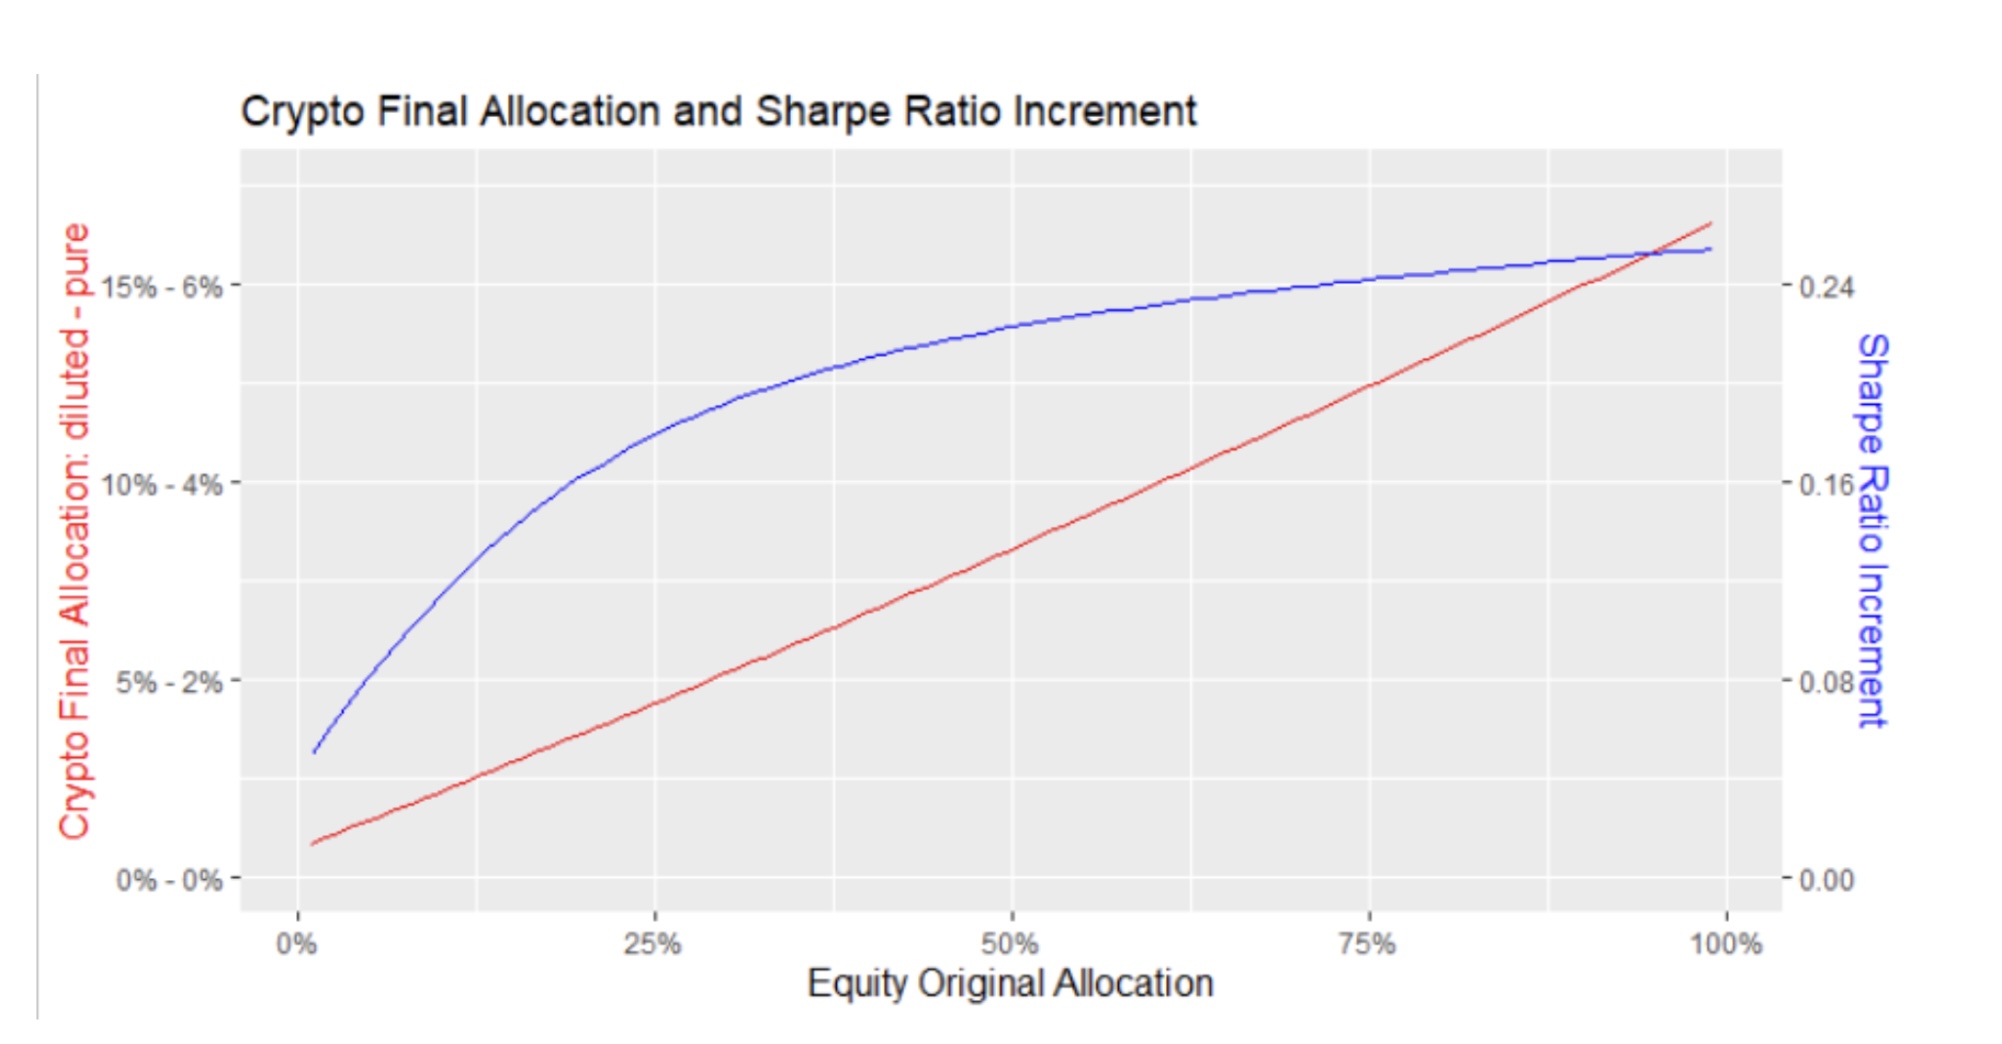
The grand finale is three-fold: We took all the portfolios ranging from 1% to 99% equity with the rest allocated to bonds (quarterly rebalance was used in all the simulations), which we called original portfolios; determined how much of the equity portion could be replaced by diluted crypto maintaining the same level of volatility, which led us to the final portfolios; and analyzed what happens with other relevant portfolio metrics. The chart below summarizes the results.

The red line (left axis) shows how much crypto (both diluted and pure) is in the final portfolios. As expected, the more equity in the original portfolio, the more room for crypto. The straight line indicates that there is a linear relationship (technically, an affine relationship once it doesn’t cross the origin) between these two variables, which can be found by a simple regression. The regression reveals that the amount of pure crypto in any given final portfolio is determined by this formula: 0.17% plus 6.40% times the fraction of equities in its respective original portfolio. Although this relationship is based on these specific indices, there are no reasons to expect significantly different behaviors for portfolios with different allocations in equities and bonds, or even for those that also include other asset classes. So, this formula can be viewed as a general rule of thumb for juicing up a portfolio by replacing equities for crypto.
But what is the impact of swapping equities for diluted crypto? We can get some hints from the blue line on the graph above (right axis). Despite crypto’s small proportion in the portfolio, there are substantial gains in risk-adjusted returns (measured by the Sharpe ratio), ranging from 0.05 to 0.25. This indicates that the final portfolios delivered significantly higher returns than their original counterparts while maintaining the same level of volatility. Additionally, the chart shows that the more crypto that is added to the portfolio, the greater the observed increase in Sharpe ratio.
Related: Crypto’s downturn is about more than the macro environment
Just to give more color to these numbers, we can take the example of the traditional 60% equities and 40% bonds allocation. This portfolio returned 7.6% yearly in our analysis period with annualized volatility of 11.4%, resulting in a Sharpe ratio of 0.59. Using the formula, the final portfolio has 4% in crypto (0.17% + 6.40 x 60% = 4%), 6% in T-Bills (4% x 1.5 = 6%), 50% in equities (60% – 4% – 6% = 50%) and 40% in bonds. As expected, the volatility is the same as the original portfolio, but the return grew to 10.2%, leading to a Sharpe ratio of 0.82, 1.4 times greater.
As these simulations indicate, the discussion shouldn’t be around whether there is room for crypto in a traditional assets portfolio. Instead, we should be talking about how best to allocate to this asset class. The formula above summarizes a simple approach that delivers good results. If you’re still skeptical about investing in crypto, take a glass of your preferred juice with the right concentration of water and think about it while you drink.
João Marco Braga da Cunha is the portfolio manager at Hashdex. He obtained a master of science in economics from Fundação Getulio Vargas before obtaining a doctorate in electrical and electronics engineering from the Pontifical Catholic University of Rio de Janeiro.
This article is for general information purposes and is not intended to be and should not be taken as legal or investment advice. The views, thoughts and opinions expressed here are the author’s alone and do not necessarily reflect or represent the views and opinions of Cointelegraph.


